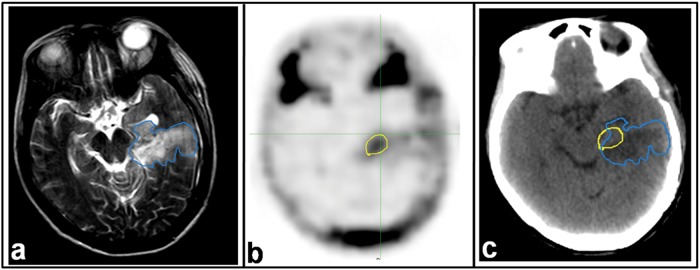
Fig 4. MRI and 18F-FLT PET-CT images from a patient with GBM.

Images were taken 21 days post-operatively and 2 days before radiotherapy. a. T2-weighted MRI. b. 18F-FLT PET image. c. CT image of PET-CT scan. Residual tumor regions defined by T2-MRI (blue line) and 18F-FLT PET (yellow line) are superimposed on the CT image.
