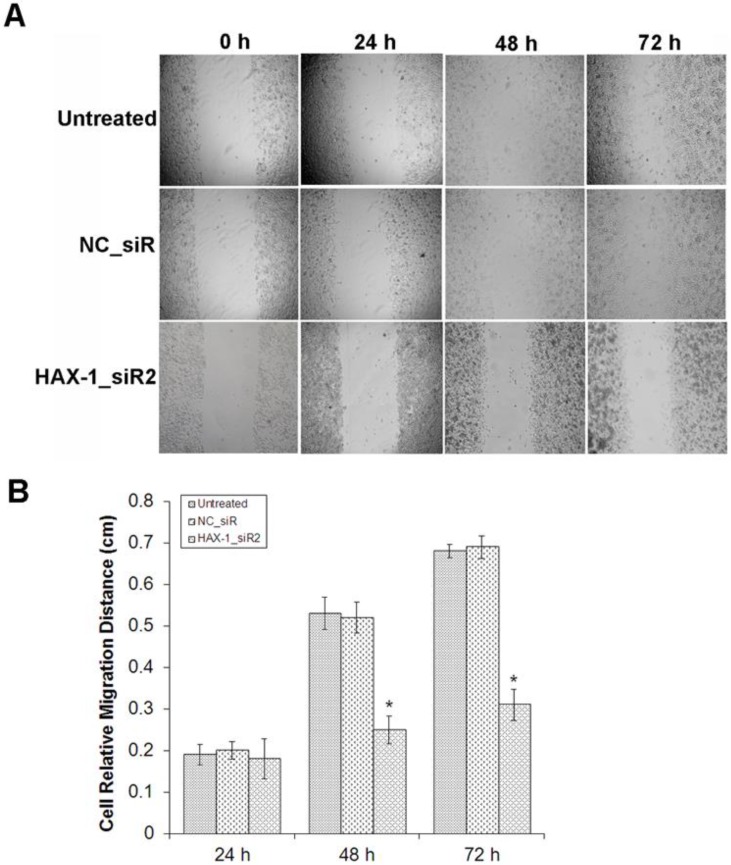
Figure 5.
The migration inhibition effects of A431 cells by HAX-1_siR2 was determined. (A) The cells with different treatments at 0, 24, 48, and 72 h (40×), (B) Cell relative migration distances in different time point treatments were presented as mean±SD. *P<0.05 compared with NC_siR and untreated group.

