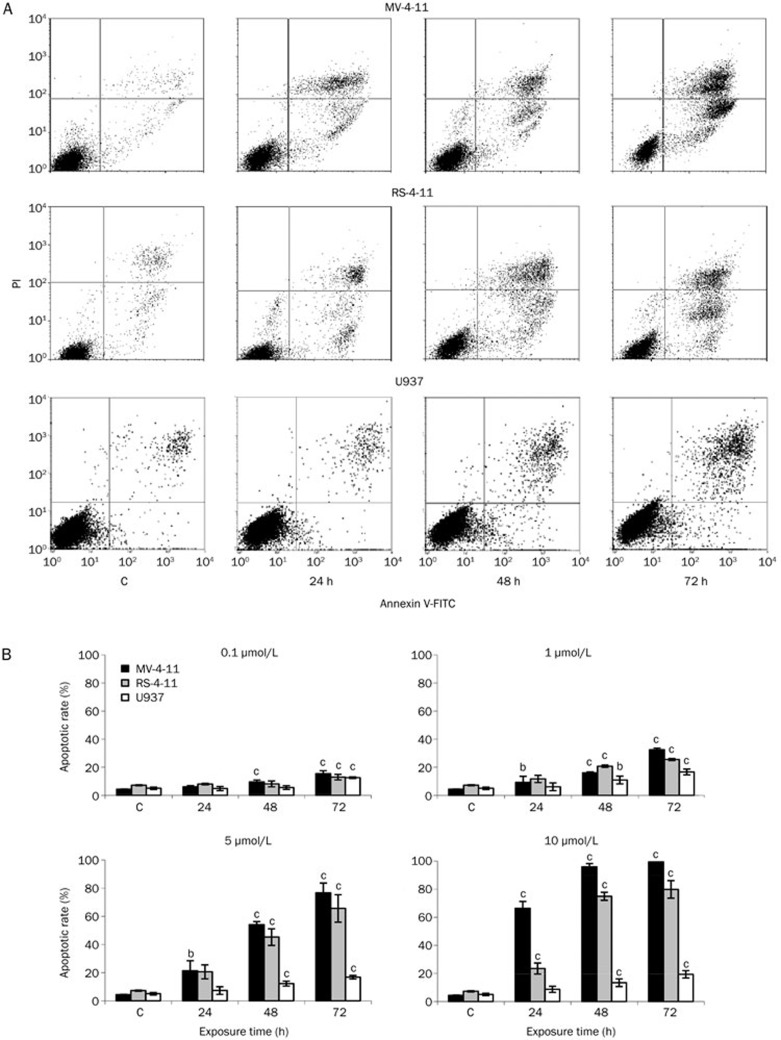
Figure 6.
Induction of apoptosis by C-1305 in AML cells. (A) Representative bivariate histograms of the Annexin V/PI staining of the cells cultured in the presence of 5 μmol/L C-1305 or vehicle (c) for the time indicated. The bottom left quadrant represents live unaffected cells (AV–/PI–), the bottom right quadrant represents early apoptotic cells (AV+/PI–), the top right quadrant represents late apoptotic and secondary necrotic cells (AV+/PI+) and the top left quadrant represents primary necrotic cells (AV–/PI+). (B) The percentage of early and late apoptotic cells among cells treated with increasing C-1305 concentrations for 24, 48, and 72 h based on flow cytometry analysis. Values are the mean±SD, n=3. bP<0.05 vs untreated cells (c), cP<0.01 vs untreated cells (c), Student's t-test.

