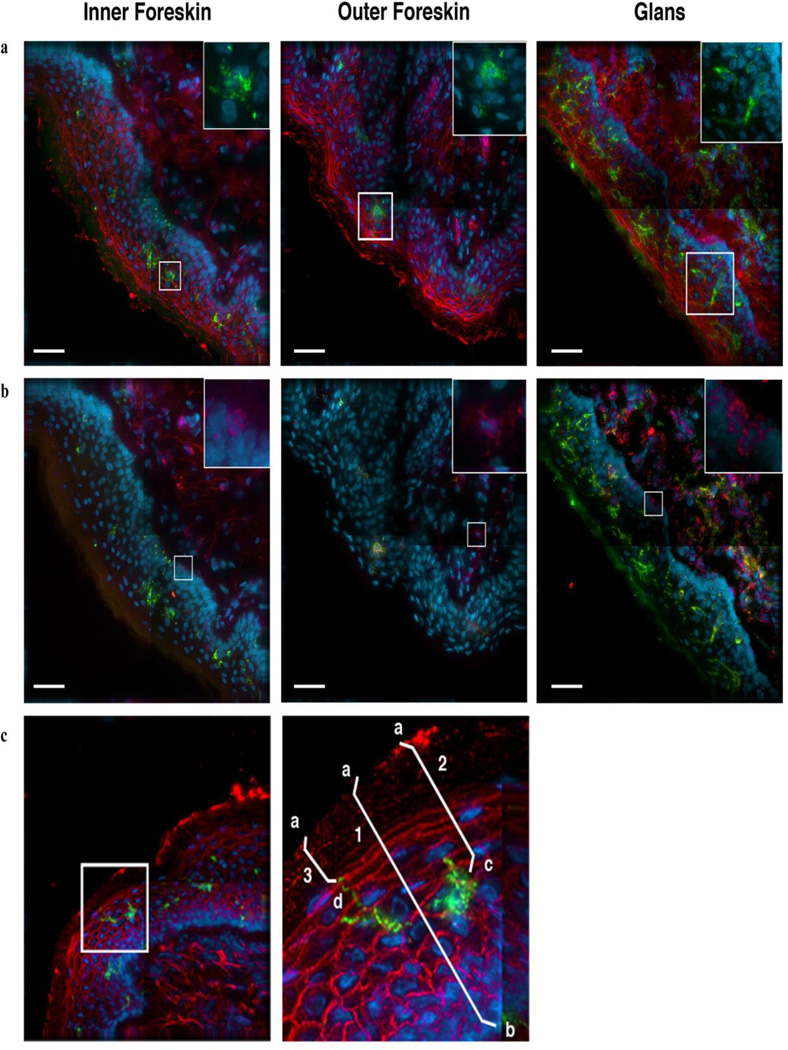
Figure 1. Identification of LCs and CD4+ cells in epithelial tissue and illustration of measurements taken to characterize cell localization.
Tissue specimens were collected from healthy donors and cultured for up to 1 week. These samples were frozen in OCT, then sectioned and stained with fluorescent antibodies to identify LCs and CD4+ cells. Images are representative of inner foreskin, outer foreskin and glans tissue specimens that were kept for up to 3 days in culture. The same image is shown in both (a) and (b), with different staining patterns. (a) LCs are identified through staining for CD1a (green) and nuclei (blue). Tissue integrity is displayed through staining with fluorescent wheat germ agglutinin (WGA, red). The boxed area, enlarged in the upper right corner, shows LCs (green) and nuclei (blue). (b) CD4+ cells are identified through positive staining for CD4 (red). LCs (green) and nuclei (blue) can also be seen, as before. The boxed area is enlarged in the upper right corner and shows characteristic CD4+ cells (red) and nuclei (blue). Scale bars, 40µm.
(c). LCs (green) can be observed in this inner foreskin specimen, which has also been stained with WGA (red) and for nuclei (blue). The boxed area is enlarged at right to show the LC in greater detail. For each cell studied, we measured (1) epithelial thickness, (2) the distance of the cell body to the surface, and, in the case of LCs, (3) the proximity of the closest LC projection to the surface. (1) Epithelial thickness was calculated from the tissue surface (a) to below the epithelial basement membrane (b). (2, 3) The proximity of cell bodies and LC projections to surface were determined by measuring the distance between the tissue surface (a) and either the cell body (c) or LC projection (d).

