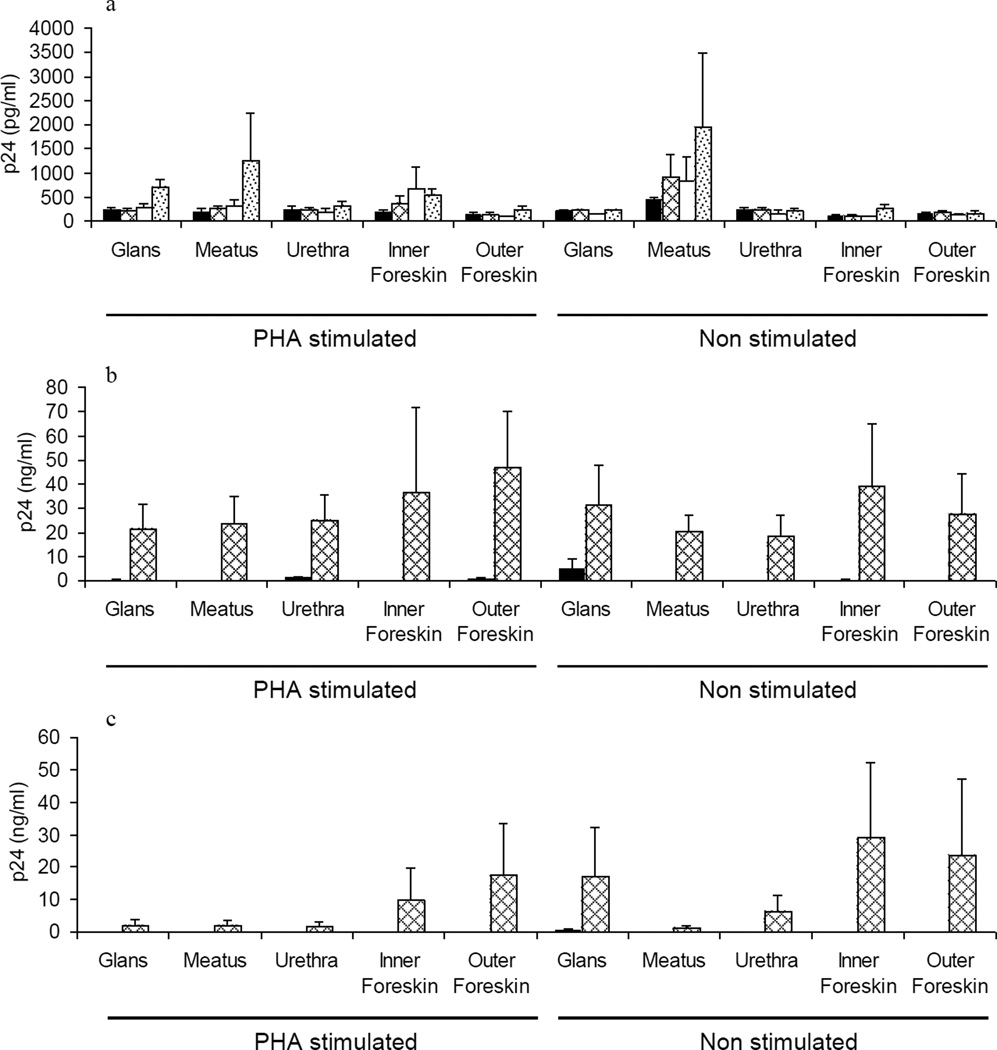
Figure 3. Replication of HIVBaL and HIVLAV in penile tissue explants and dissemination of the infection by migratory cells.
Figure 3a shows the time course of HIVBaL replication in tissue explants at days 4 (black bars), 7 (grey net bars), 9 (white bars) and 11 (grey dotted bars) days post infection. Figure 3b and 3c show dissemination of HIVBaL (Figure 3b) and HIVLAV (Figure 3c) infection by migratory cells isolated from different tissue explants, folowing 4 (black bars) and 7 (grey net bars) day co-culture with indicator T cells. Data represent the mean p24 ± standard error of the mean of 3 separate donors; each condition was tested in triplicate. P24 levels for uninfected controls and in the samples exposed to AT-2 treated virus were undetectable (data not shown).

