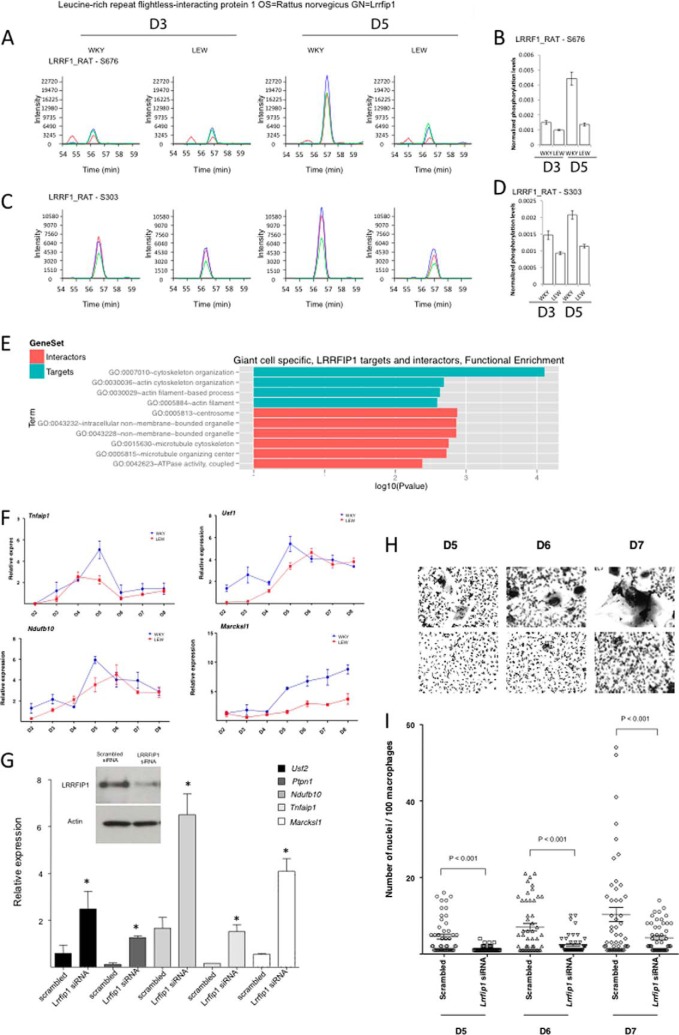
Fig. 5.
LRRFIP1, a new regulator of MGC formation. A and C, extracted ion chromatograms of the two LRRFIP1 phosphopeptides exhibiting differential phosphorylation across time points in both strains. On each graph the blue, green and red curve show the intensity of the three main isotopic peaks. B and D, show the associated quantification of normalized phosphoprotein abundance. E, represents GO enrichment of LRRFIP1 direct interactors (salmon) and predicted targets specifically up-regulated in MGC (turquoise). F, shows the expression of LRRFIP1 predicted targets over time in both WKY and LEW during multinucleation. G, the effect of LRRFIP1 knockdown on its predicted targets. H, and I highlight the role of LRRFIP1 in macrophage fusion by showing the reduction of macrophage multinucleation following LRRFIP1 Knock down.

