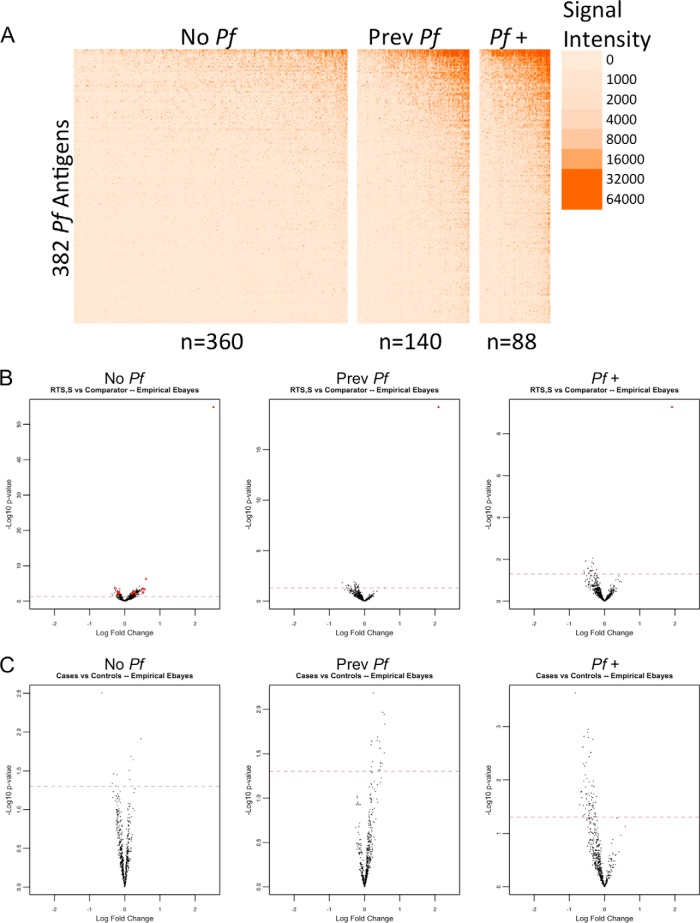
Fig. 4.
Antibody reactivity by exposure group. A The heatmap shows antibody levels for 382 Pf antigens in rows and individual samples in columns. Children were stratified by exposure group (No Pf: children with no documented exposure, Prev Pf: previous exposures, Pf +: exposure at time of sampling), and columns were sorted by mean signal intensity within each strata. Antibody levels are shown on the linear scale, with NoDNA subtraction occurring on the linear scale with transformation of negatives to zero. The color scale is graduated by signal intensity, as shown on the right of the heatmap. B and C The volcano plots show differentially reactive antibody responses, stratified by exposure groups, between vaccine group and nested case-control comparisons, respectively. The red dashed lines represent the threshold of statistical significance (p = 0.05).

