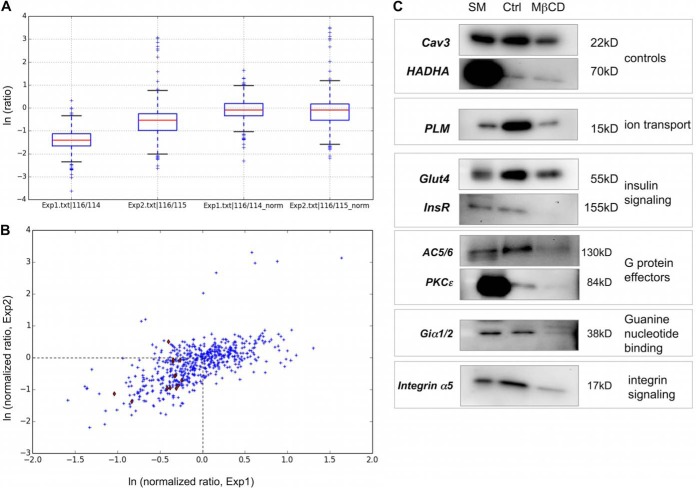
Fig. 2.
iTraq analysis of control and MβCD treated BCEMs. A, Distribution of iTraq ratios from two independent experiments before (left) and after (right) normalization. B, After normalization, iTRAQ ratios show good reproducibility between experiments. Proteins annotated as caveolar residents in Uniprot are highlighted in red. The caveolar proteome was defined as the boxed area. C, Candidate caveolar proteins were verified by immunoblotting fraction 4 purified from control and MβCD treated cells. SM = gradient starting material.

