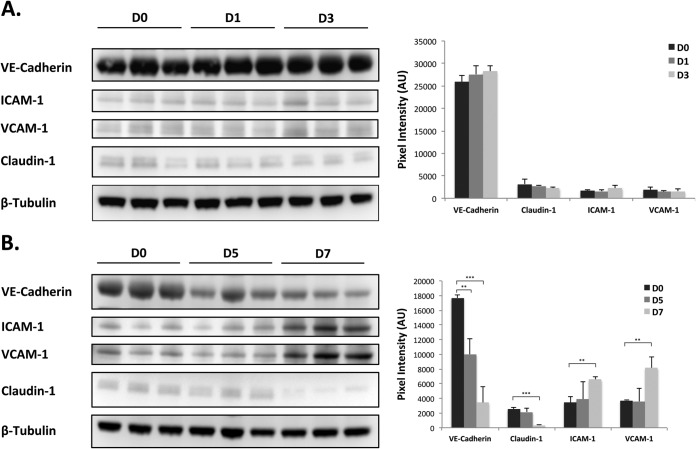
Fig. 5.
Temporal Western blot analysis of claudin-1, VE-cadherin, ICAM-1, and VCAM-1 expression. Lung samples were processed and Western blot analysis was performed as described in Materials and Methods. Spot intensities were quantified and normalized to the loading control. Data were averaged for each group (D0, D1, D3, D5, and D7) and the plotted pixel intensities represent the average intensity of the expressed marker for each animal from the respective group (n = 3 for each group). Standard deviations were calculated using the Student's t test.

