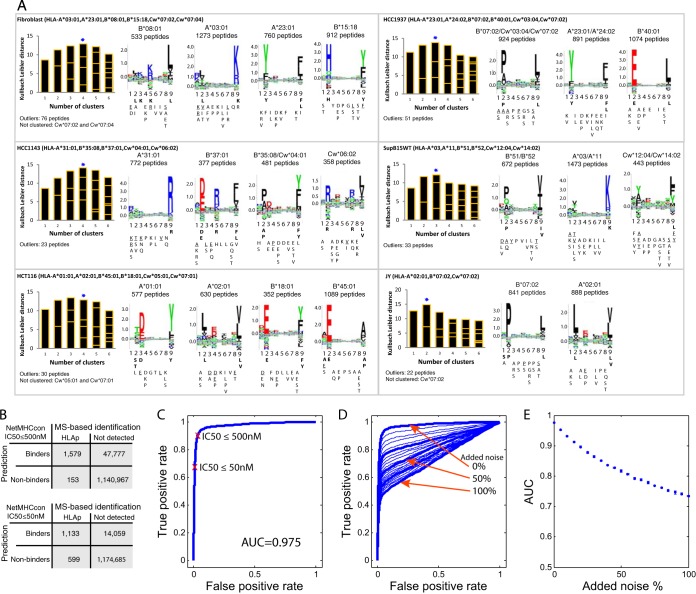
Fig. 4.
High confident identification of purified HLA-I peptides. A, Defining motifs directly from the mixture of identified peptides. Gibbs clustering analysis was performed for the purified 9-mer HLA-I peptides from the different cell lines. The motifs of the isogenic cell lines SupB15WT and SupB15RT cells were identical; therefore the results are shown only for SupB15WT. For each initial number of clusters the information content of the alignment is shown as a bar plot, where the size of each block within a bar is proportional to the size of a given cluster. The blue star marks the number of clusters that were selected based on the optimal fitness (higher KLD values) and minimum outliers, and their sequence logo plots are shown with the number of HLA-I peptides in each cluster and the assigned HLA-I alleles that fit each cluster. Binding motifs were calculated for each cluster from the frequency of the amino acids (AA) in positions P1 to P9 in the peptides sequences (see Supplemental Data). Frequency of more than 30% was classified as a dominant anchor motif (bold), more than 20% as a strong motif (underline), and more that 10% as a weak motif. B, Confirming the accurate identification of the observed peptides by predicting their affinity to the expressed alleles. We predicted using NetMHCcon (39) the binding affinity (maximal predicted binding affinity; HLA-A*02:01 and HLA-B*07:02) of the peptidome data set of 9-mer peptides from JY cells, and estimated the performance of the predictor using the expressed proteins as the set of input sequences. We compared the default affinity score <500 nm to include weak binders and the high affinity score of <50 nm to restrict to strong binders only. C, The computed Receiver Operating Characteristic (ROC) curve for the binding affinity to the HLA-I based on the predicted 9-mer epitopes from JY cells. The AUC (area under the curve) value is 0.975. D, Evaluating the deterioration in the ROC analysis when introducing noise of randomly selected 9-mer sequences from the expressed proteins. 9-mer peptides were added from 0 to100%, in steps of 5%, to the list of observed 9-mer peptides from JY cells. E, AUC values calculated from ten iterations of noise introduction.

