Fig. 2.
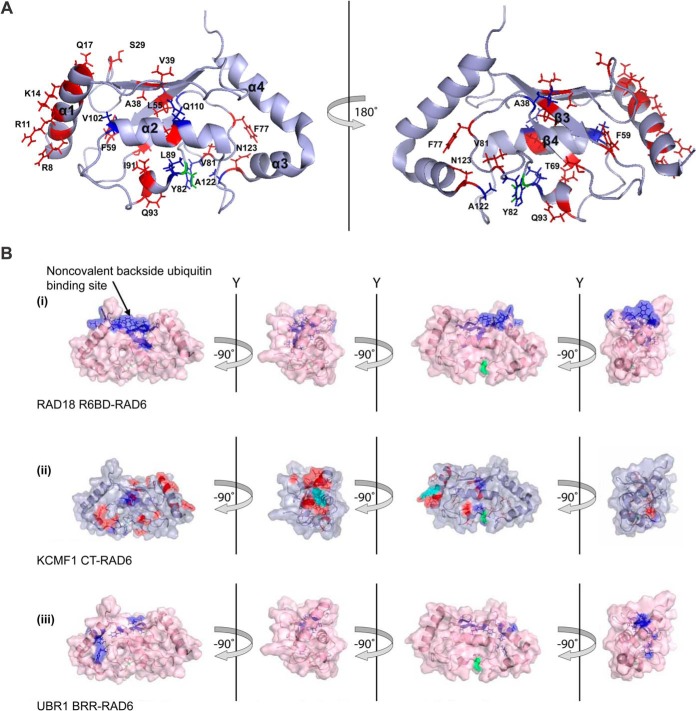
Further analysis of the KCMF1-RAD6 interaction. A, Significant (>0.04) chemical shift perturbations (red) and resonances that disappear (blue) upon KCMF1 CT addition mapped onto the RAD6 structure PDB 2Y4W (50). Catalytic residue Cys88 highlighted in green. B, Binding sites for RAD18, UBR1 and KCMF1 protein fragments on RAD6. (i) RAD6 residues implicated in the RAD18 interaction (44). Residues that displayed significant CSPs when 15N-RAD6 was titrated with a RAD6-binding domain (R6BD) synthetic peptide derived from RAD18 are indicated in blue. Cys88 in green. (ii) RAD6 residues involved in the KCMF1 CT interaction. Red highlighted residues display significant CSPs, residues with decreasing intensity in blue. (iii) RAD6 residues implicated in the interaction with UBR1. Residues displaying significant CSPs when 15N-RAD6 was titrated with a basic residue-rich region (BRR) synthetic peptide derived from UBR1 (44) are shown in blue. CSPs for RAD6A were mapped onto the RAD6B structure (PDB 2Y4W).

