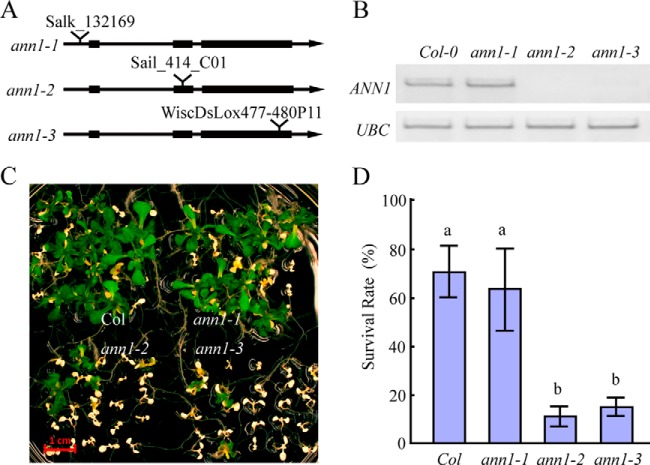
Fig. 3.
AtANN1 is essential for plant resistance to heat shock treatment. A, Diagram shows the T-DNA insertion positions for different AtANN1 T-DNA mutants. B, RT-PCR analysis of AtANN1 expression level in different ann1 T-DNA mutants. C, The response of different ann1 T-DNA mutants to heat-shock treatment. Seven-day-old seedlings grown on 1/2 MS plates at 22 °C were shifted to a 45 °C water bath for 13 min and then returned to 22 °C and allowed to recover for 1 week before taking photos. Scale bar represents 1 cm. D, Quantification of survival rate of seedlings shown in C. Data represent the mean value from five independent experiments, with 25 seedlings per experiment. One way ANOVA test was performed. Statistically significant differences are indicated by different lowercase letters (p < 0.05). Error bars represent ±S.D.

