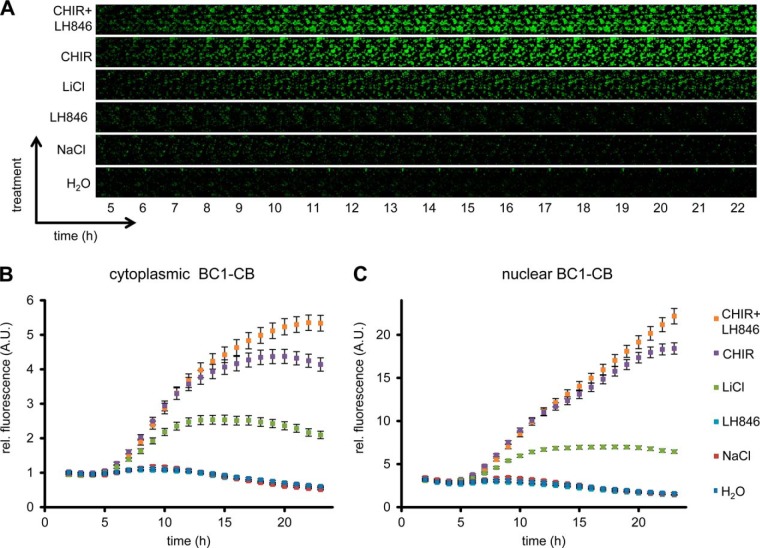
Fig. 10.
Time-lapse microscopy of compound-treated HeLa_BC1-CB cells. A, HeLa_BC1-CB cells were imaged in hourly intervals for 24 h with control treatment (H2O) or in the presence of NaCl, LiCl, LH846, CHIR, or a combination of CHIR and LH846. Time-lapse imaging of HeLa_BC1-CBs is shown for each condition starting 5 h after compound treatment. After image segmentation mean fluorescence intensity in the cytoplasm, B, and nuclei C, was determined and values of three biological replicates (∼500 cells each) were plotted against time ± standard errors.

