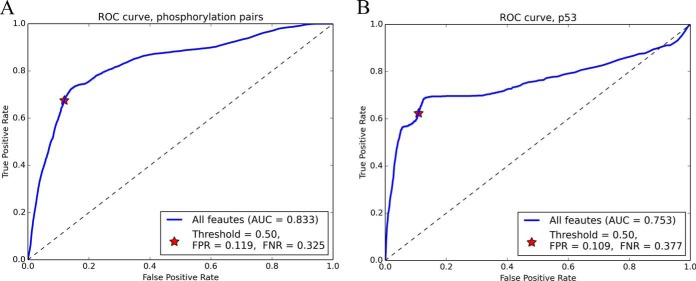
Fig. 5.
Evaluating the robustness of the prediction model using biased training sets. A The ROC curve of predicting cross-talk between phosphorylation–phosphorylation pairs using the model built from PTM pairs of other PTM type combinations. B The ROC curve of predicting the cross-talk pairs on protein p53 using the model built from PTM pairs in all other proteins.

