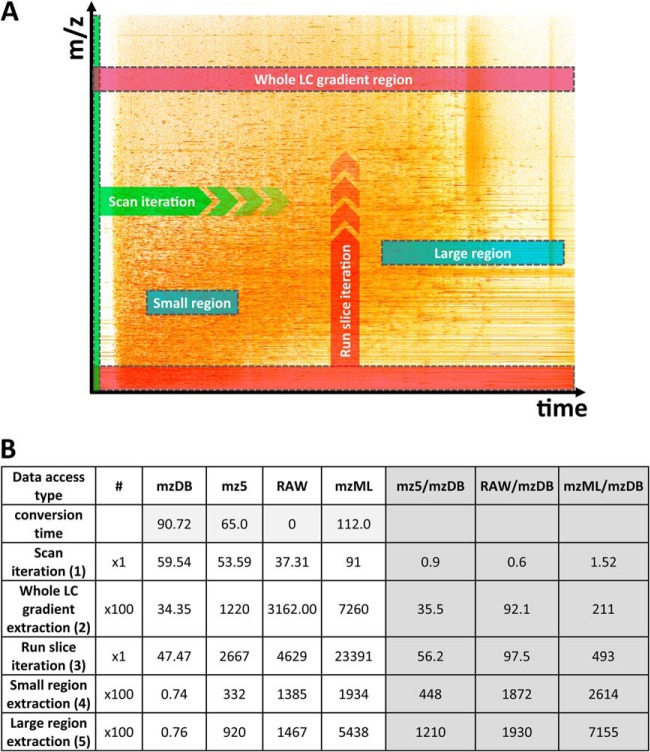
Fig. 4.
Benchmarking of the different datafile formats on DDA data. A, Schematic representation of the data accesses used to assess performance. Different kinds of reading and data extraction were performed on a DDA file (1.6 GB), illustrated here as a bidimensional LC-MS map along m/z and RT axes. Test 1 (green): Sequential reading, by scan iteration, of all the MS and MS/MS spectra, representing the most classical data access type; Test 2 (purple): extraction of a region encompassing a m/z window of 5 Da on the whole RT range (run slice). In this second test, 100 extractions of this type were performed, for m/z windows centered around 100 randomly selected m/z values, and the total reading time was measured; Test 3 (red): systematic iterative reading of the whole file along the m/z dimension with a m/z window of 5 Da (iteration of run-slices); Test 4 and 5 (blue): targeted extraction of specific regions of the LC-MS map, defined as “small” rectangular regions (60 s and 5 Da windows) or “large” rectangular regions (200 s and 5 Da windows). For test 4 and 5, 100 different extractions were performed in each case, around randomly chosen m/z and RT values. In the case of mzDB, data access implemented in tests 2 and 3 take advantage of the run slice indexing introduced in the format, whereas tests 4 and 5 take advantage of the R*Tree index for rapid access to the targeted region. B, Benchmarks results of the tests for the different formats (mzDB, mz5, native raw, and mzML). Results are expressed as total access time in seconds for the different tests described above, on the four compared file formats. The conversion time (seconds) needed to convert the raw file into mzDB, mz5, and mzML respectively is indicated in the first line (uncompressed mode for mz5 and mzML, profile mode for mzDB). The three last columns indicate the ratio in total access time between mzDB and the other formats.

