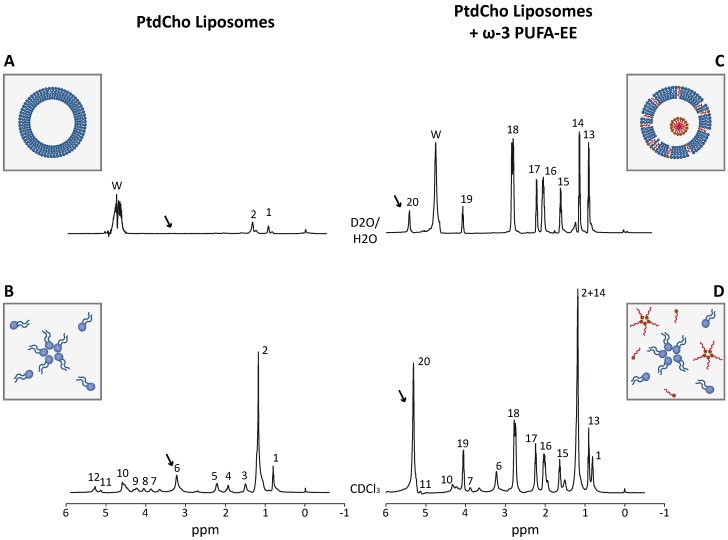
Figure 2.
Characterization of liposomes loaded with ω-3 PUFA-EE by Magnetic Resonance Spectroscopy. Representative HRMAS spectra (500.13 MHz, 4 °C, 4000 Hz rotation) of aqueous (A, C) and chloroform (B, D) suspensions from empty liposomes (A, B) and from liposomes loaded with ω-3 PUFA-EE (C, D). Resonance numbers refer to the assignments indicated in Table 1 and the structures depicted in Scheme 1. Inserts A and B depicts schematically the organization of PtdCho molecules (blue) in the bilayer structure of aqueous liposomal suspensions or in the chloroform suspension as individual PtdCho molecules or inverted micelles with the choline headgroups oriented inwards. Inserts C or D illustrate the localization of ω-3 PUFA-EE inserted in the membrane or nanogoticules in the lumen of aqueous liposomal suspensions, or the inverted micelles and free molecules of PtdCho and ω-3 PUFA-EE in chloroform suspensions, respectively.

