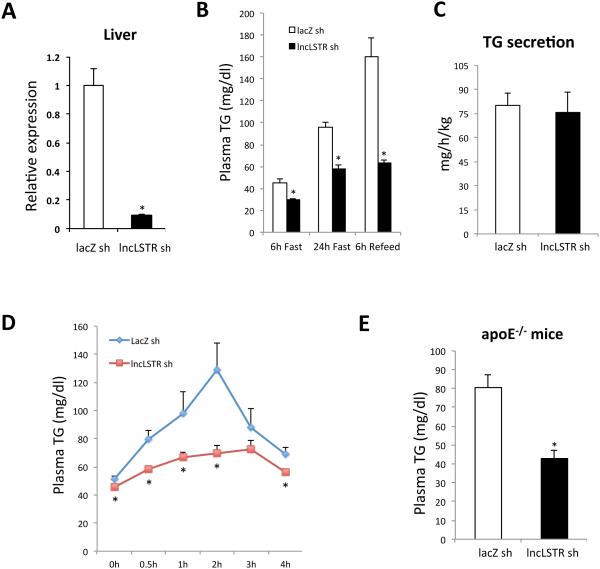
Figure 2. LncLSTR knockdown reduces plasma TG levels in mice.
(A) Expression levels of lncLSTR in the livers of control and lncLSTR KD mice received shRNA adenoviruses for LacZ (LacZ sh) and lncLSTR (lncLSTR sh) respectively (n=6).
(B) Plasma TG levels in lncLSTR KD (lncLSTR sh) and control (LacZ sh) mice (n=7) after a 6-hour fast (6h Fast), a 24-hour fast (24h Fast), or 6-hour refeeding after a 24-hour fast (6h Refeed,).
(C) TG secretion rates in lncLSTR KD and control mice (n=6) determined by administration of Poloxamer-407 to block TG uptake.
(D) Plasma TG levels in lncLSTR KD and control mice (n=7) orally receiving olive oil.
(E) Plasma TG levels in control (n=8) and lncLSTR KD (n=7) ApoE−/− mice.
Error bars represent SEM, *p<0.05.

