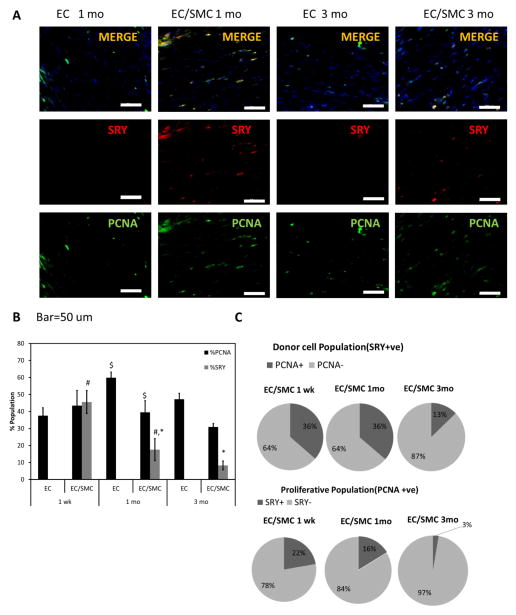
Figure 5. Evaluation of donor cell retention.
(A) Immunostaining for SRY (red) and PCNA (green). Bar: 50 μm. (B) Percentage of SRY+ (donor) and PCNA+ (proliferating) cells in EC or EC/SMC TEVs at 1 mo and 3 mo (#, *, $: p<0.05, n=3). (C) Pie charts show %SRY+ cells within the proliferative population of PCNA+ cells and PCNA+ cells within the SRY+ (donor) cell population.

