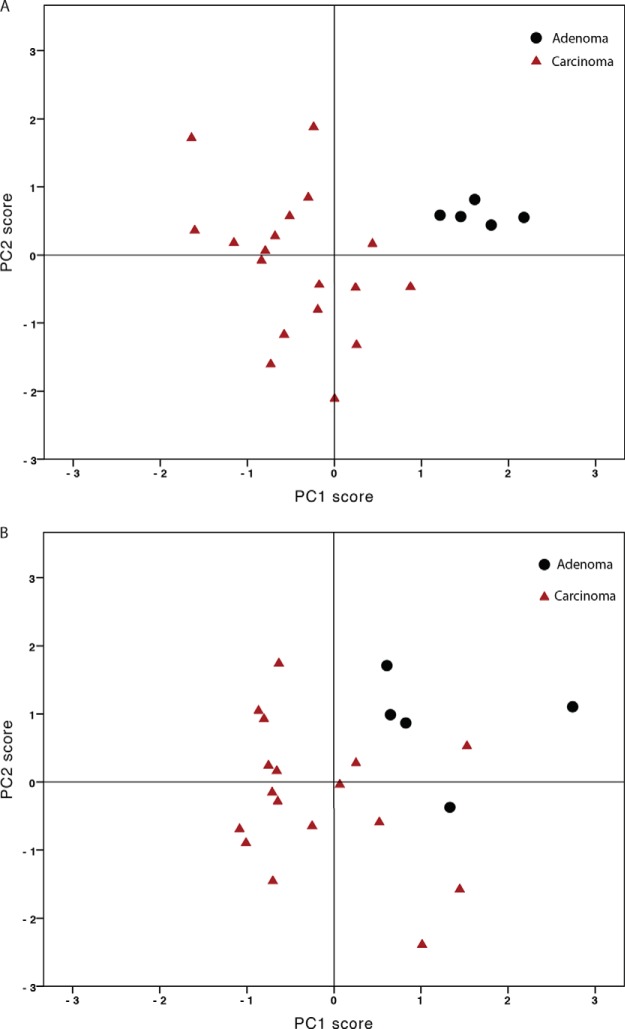
Fig. 4.
Principal component analysis separates rectal adenomas and carcinomas based on neutral A, and acidic B, N-glycosylation. Black dots represent carcinomas and red triangles represent adenomas. For neutral glycans (Bartlett's test: p = 0.005, Kaiser-Meyer-Olking test: 0.588, PC1 (42.5%) versus PC2 (25.6%)). For acidic glycans (Bartlett's test: p < 0.00001, Kaiser-Meyer-Olking test: 0.741, PC1 (83.3%) versus PC2 (8.1%).

