
Fig. 5.
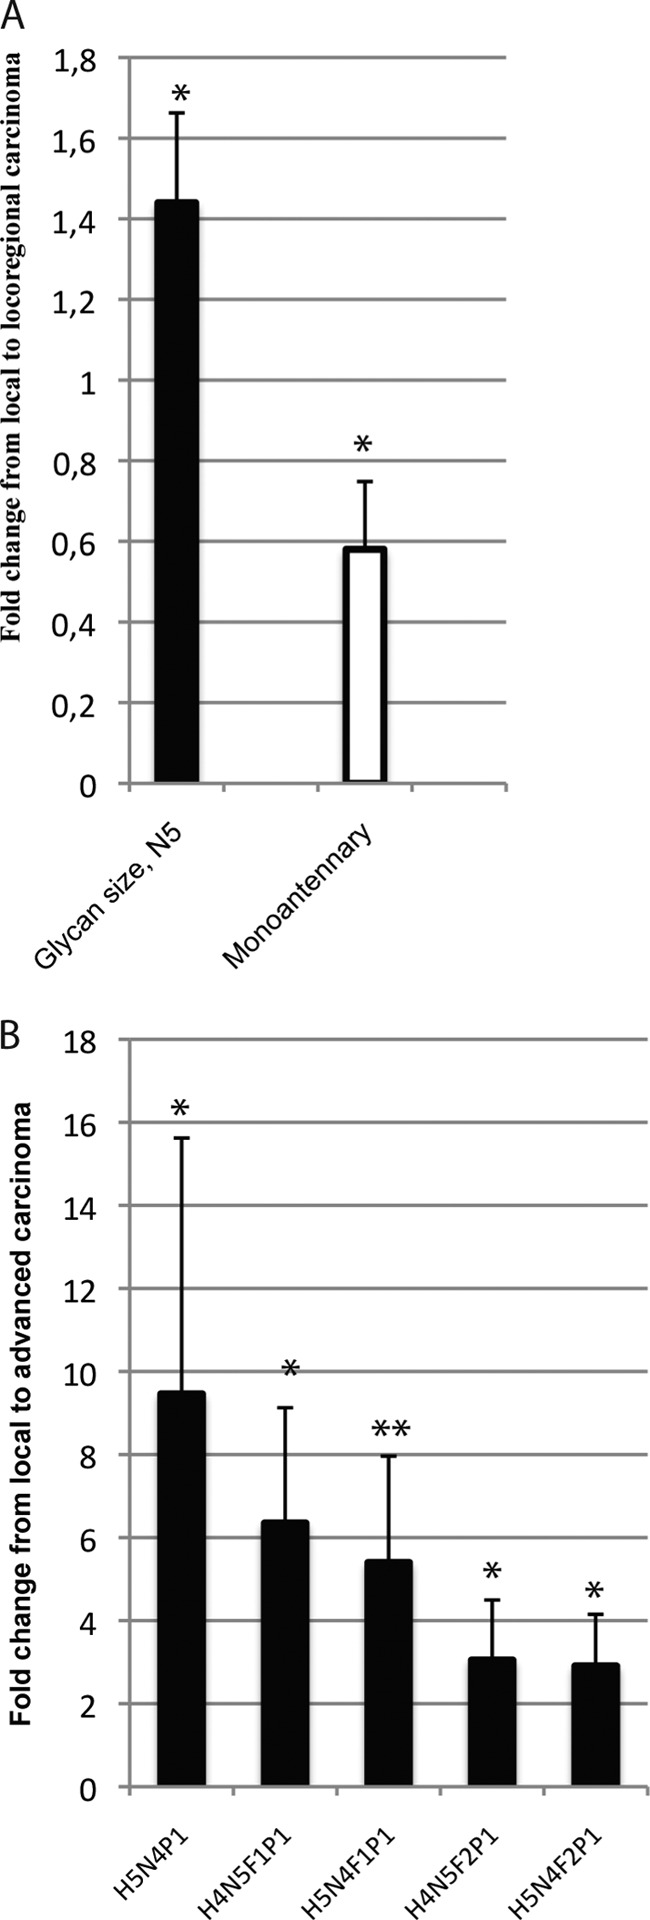
Differences of acidic N-glycosylation between A, local and locoregional rectal carcinoma, B, local and advanced rectal carcinoma. Fold change of the mean relative intensity of glycan structures from A local (stage I–II) to locoregional carcinomas (stage III), and local to advanced carcinoma (stage III–IV). Statistical analysis by the Mann-Whitney-test: * = (p < 0.05), ** = (p < 0.01), *** = (p < 0.001), **** = (p < 0.0001), NS = Nonsignificant. Structural assignments based on: (16, 18).