Fig. 2.
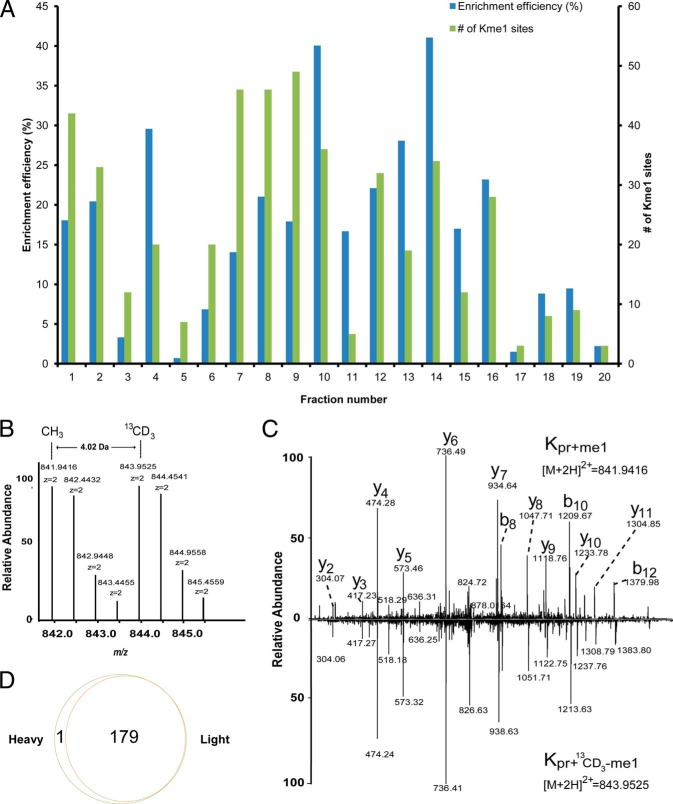
Proteome-wide analysis of lysine monomethylation using an isotopic labeling approach. A, Affinity enrichment efficiency and the number of methylated peptides identified in each fraction. B, MS spectrum of a “Light” and “Heavy” methyl-coded monomethylated peptide of protein EZH2from HeLa cells, showing twin peaks with a mass difference of 4.02 Da induced by isotopic labeling using 13CD3. C, Ion trap CID spectra from the “Light” and “Heavy” methylated peptide YSQADALKme1YVGIER of protein EZH2 from HeLa cells. The 4-Da mass shift of the b- and y-ions of the “Heavy” peptide relative to its “Light” counterpart was induced by the isotopic methyl group. D, The overlap of the methylated peptides from “Light” and “Heavy” methionine-labeled HeLa cells.

