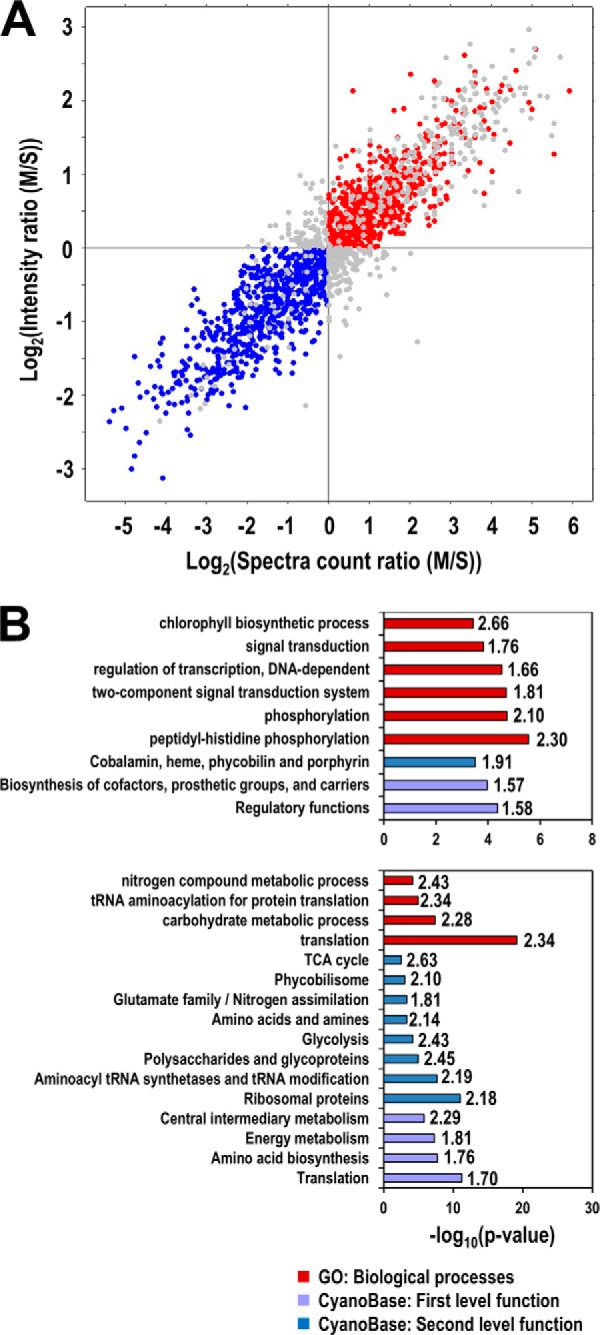
Fig. 5.

Enriched functions of non-TM containing proteins that are tightly or weakly associated with the membranes. A, Selection of proteins tightly (red) and weakly (blue) associated with the membranes. For simplicity, proteins were divided into only two populations according to their predicted tightness of membrane association. Tight membrane-associated proteins were selected if their logarithm transformed MS ratios for both spectra counts and peak intensities are greater than zero, whereas proteins with weaker membrane association were selected if both of their M/S ratios are less than zero. B, Enriched functions in tightly (upper panel) and weakly (lower panel) membrane-associated proteins. The enrichment analysis was performed using Fisher's exact test against the CyanoBase functional categories and Gene Ontology (GO) terms. Only GO terms in biological processes are shown. The significance of enrichment is shown by the p value of the test (bars), and the enrichment factors are also shown to the left of bars.
