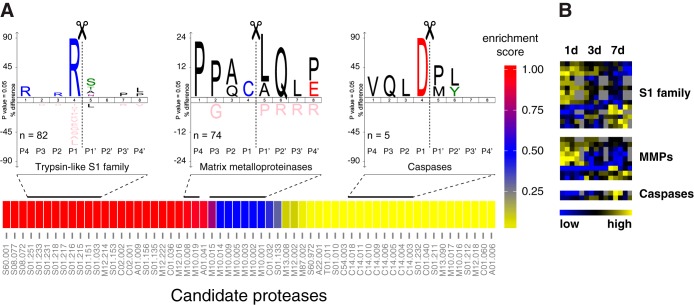
Fig. 6.
Assessment of active protease groups and their cleavage dynamics. A, Enrichment map of candidate proteases and specificity logos of associated cleavage sites. Cleavages were related to candidate proteases (represented by Merops identifiers) with help of cleavage data in the Merops database. Color code indicates a relative enrichment score (1-p) for candidate proteases calculated from hypergeometric p values (p). IceLogos were generated from all cleavage sites assigned to indicated protease groups. Specificities follow typical patterns with Arg in P1 for trypsin-like S1 family proteases, Pro in P3 and Leu in P1′ for MMPs and Asp in P1 for caspases. B, Abundance clustering of neo-N termini associated with candidate proteases. Heatmap represents a subset of N-terminal peptides with significantly differential abundances in wound fluids at distinct time points after injury shown in Fig. 3D.

