
Fig. 1.
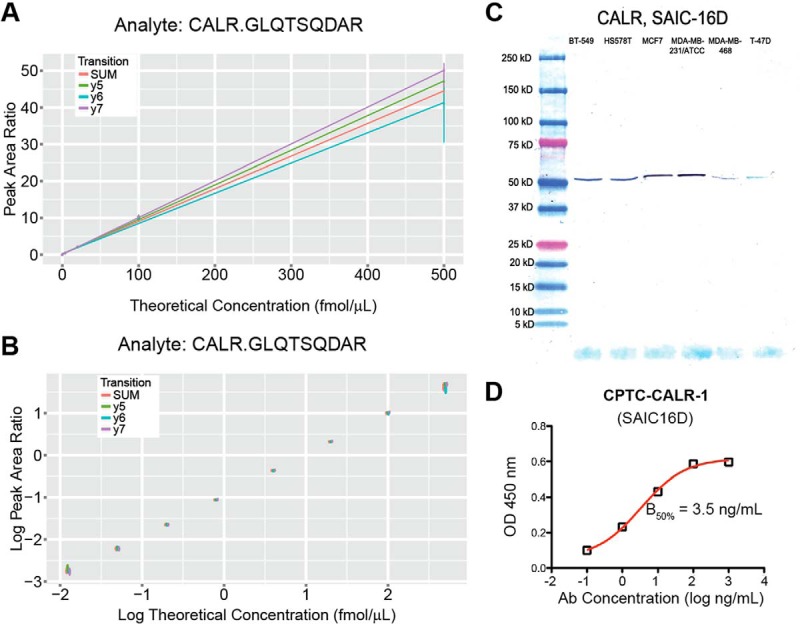
Characterization of assays and antibody reagents. Immuno-MRM-MS response curve data in linear A, and log space B, and Western blot C, and ELISA D, data for the monoclonal antibody to peptide target GLQTSQDAR from the protein calreticulin (CALR; target peptide ID SAIC-16D). For the response curves, the heavy-to-light peak area ratios for the peptide's transitions are plotted versus the heavy peptide's theoretical concentration; y5 refers to the product ion; SUM refers to the response curve for which the peak areas of all transitions were summed before taking the peak area ratios; the error bars indicate the minimum and maximum (i.e. range) of the peak area ratios of the three capture and LC-MRM-MS replicates. For the Western blot, the expected molecular weight of calreticulin is 48 kDa (UniProt). For the ELISA assay, the B50% value was used as a relative value to assess the different mAbs' performances in these experiments; it indicates the inflection point of the curve and represents the mAb concentration at half of the calculated maximum binding of the mAb.