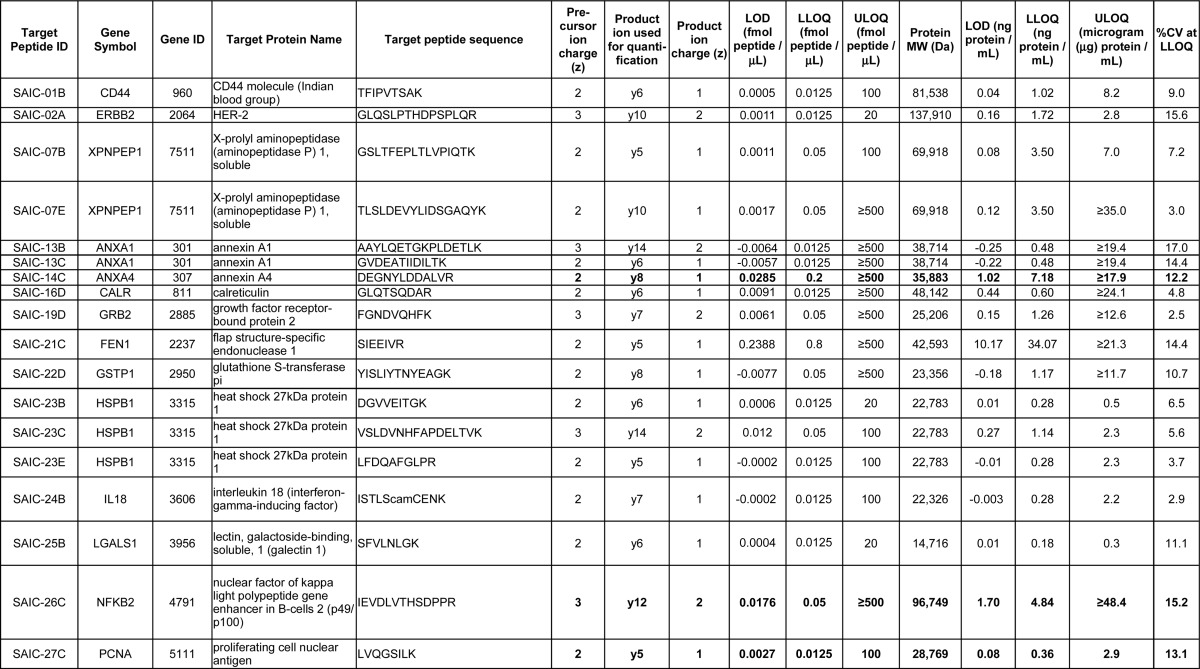
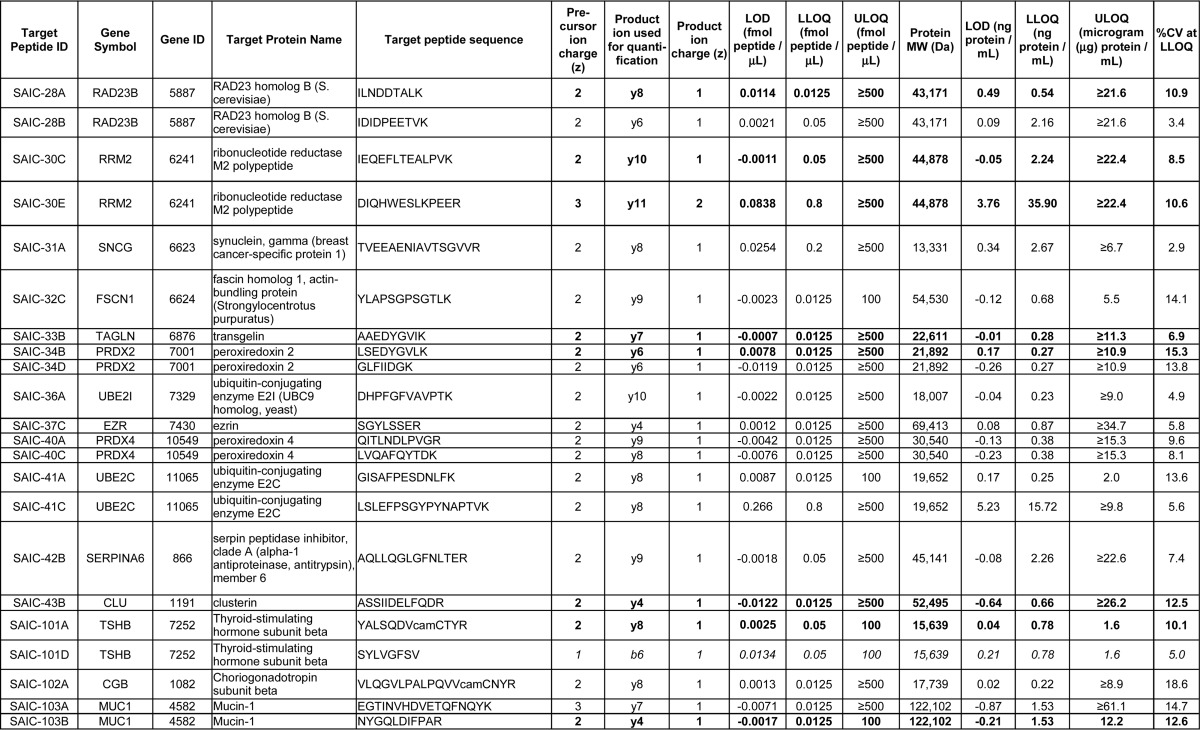
Table I. Summary of the immuno-MRM reverse response curve data using 35 recombinant and 5 hybridoma mAbs. The table is ordered according to Target Peptide ID. The 35 recombinant mAbs are listed first (SAIC-01B to SAIC-43B), and the 5 hybridoma mAbs (SAIC-101A to SAIC-103B) are listed at the bottom of the table. The response curve data are given for the quantifying product ion (transition), which is defined as the most intense transition of a peptide that did not have any interfering peaks in the heavy signal of the blank capture samples of the response curves. The response curve data of the 11 peptide targets for which the response curve experiments were repeated (due to interferences) are indicated in bold. The response curve data of the SAIC-101D (SYLVGFSV) peptide target for which the response curve was repeated (due to instability of the peptide) are indicated in italics. Protein molecular weights (MW) were obtained from UniProt, with the MW of Isoform 1 given if more than one isoform was reported, and the ng/ml or μg/ml protein concentrations were calculated assuming complete trypsin digestion. camC, carbamidomethylated Cys; LOD, limit of detection; LLOQ, lower limit of quantification; ULOQ, upper limit of quantification. Of note, for assays whose curves did not level off, the ULOQ reported here is a minimum estimate of the true ULOQ and is given as ≥500 fmol/μl.