Fig. 3.
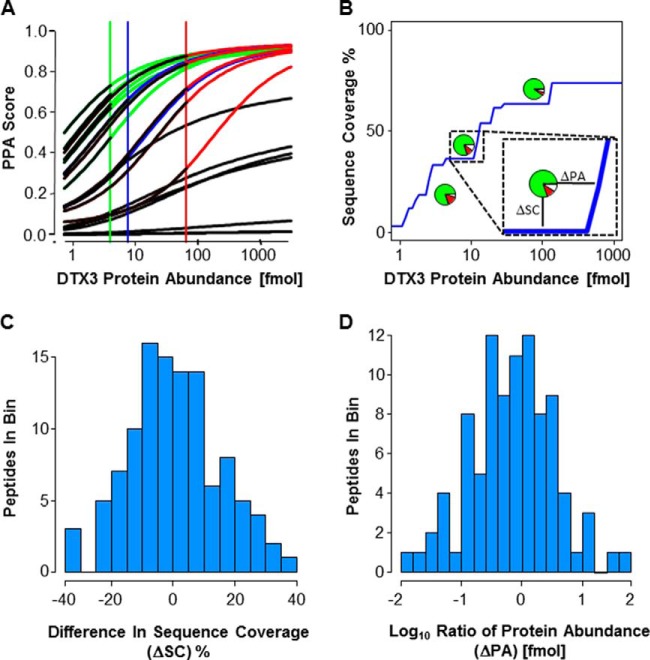
Validation of PPA Enrichment Prediction. A, Each line represents the abundance depended PPA score for all individual peptides from DTX3 at different protein concentrations. These predictions were compared with the outcome of LC-MS/MS analyses of DTX3 digests at three different concentrations. Black: not-detected; green: detected at 4 fmol; blue: detected at 7.6 fmol; red: detected at 65.2 fmol. B, Prediction of protein abundance-dependent sequence coverage (blue curve) for DTX3. For a sequence coverage prediction, peptides with a PPA score > 0.5 were considered to be detected. Inset highlights our two evaluation metrics – ΔSC and ΔPA. The pie charts represent the experimental data points. Green color: correct prediction; red color: peptides were not detected, but predicted to be detected; white color: peptides were detected, but not predicted to be detected. Each data point (supplemental Fig. S4C) contributes to C and D. C, This histogram uses all 110 data points. D, This histogram uses 95 data points (all 110 data points are shown in supplemental Fig. S4D). We eliminate 15 data points where the maximal sequence coverage of our prediction was less than the actual observed sequence coverage. This results when a single peptide from a protein that has a very low PPA score is actually detected.

