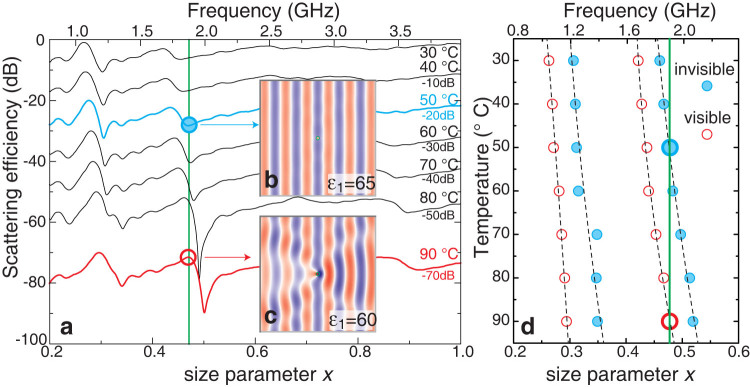
Figure 4. Experimental demonstration of tunable invisibility.

(a) Measured temperature dependence of the scattering efficiency of a glass tube filled with water. Curves are shifted vertically by the values marked on the plot. Inserts (b,c) show the calculated magnetic fields at the frequency 1.9 GHz in the regimes of the Fano invisibility and strong Mie scattering, respectively. (d) Measured positions of dips in the scattering efficiency, corresponding to invisible cylinder, and peaks, corresponding visible cylinder and strong Mie scattering. Dashed lines are result of linear fitting to the measured maxima and minima positions.
