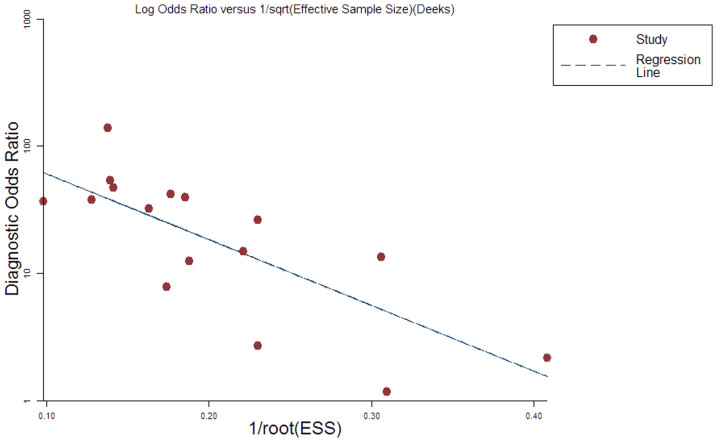
Figure 5. Deek's plots for included studies of serological anti-PLA2R test.
Linear regression of log odds ratios on inverse root of effective sample sizes as a test for funnel plot asymmetry in diagnostic meta-analysis. A non-zero slope coefficient is suggestive of significant small study bias (p < 0.05).

