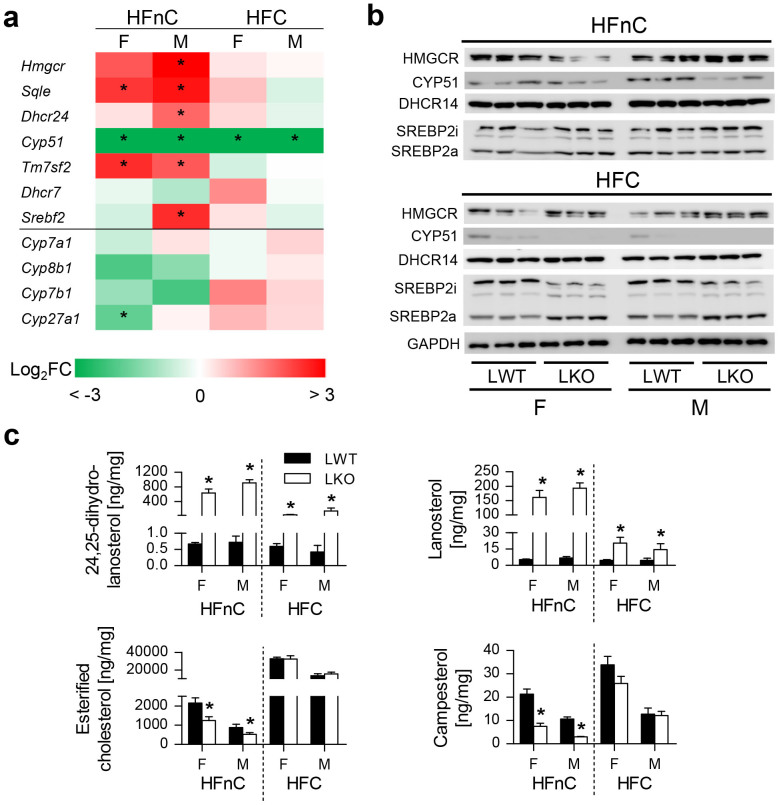
Figure 6. Sex-related response of cholesterol homeostasis to dietary fats in absence of hepatocyte Cyp51.
(a) Fold change differences between the LKO and LWT mice in cholesterol homeostasis genes (n = 5) on the high-fat no-cholesterol (HFnC) and high-fat with cholesterol (HFC) diet. Statistically significant changes are marked with an asterisk (*). Color scale represents log2 fold change (FC) differences from −3 to 3. (b) Western blot analysis of cholesterogenic enzymes and cholesterol homeostasis proteins. A representative western blot of GAPDH is presented. (c) Hepatic levels of sterols and campesterol (n = 8–10). Columns represent means and error bars represent SEMs. Uncropped western blots are presented in Supplementary Figure 11. SREBP2i – inactive membrane-bound form; SREBP2a – active nuclear form. * p < 0.05.

