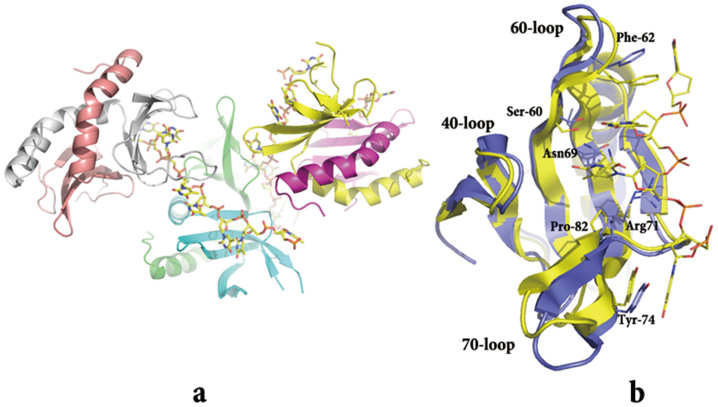
Figure 4. The overall structure of the MoSub1-ssDNA complex and comparison between DNA-bound and DNA-free structures of MoSub1.
Overall structure of the MoSub1-DNA complex (a). Chains A-F, shown in cartoon representation, are coloured in cyan, green, yellow, magenta, brown, and grey separately. DNA is shown in stick representation. Superposition of the structures of MoSub1 DNA-free (blue) and MoSub1-DNA complex (yellow) (b).

