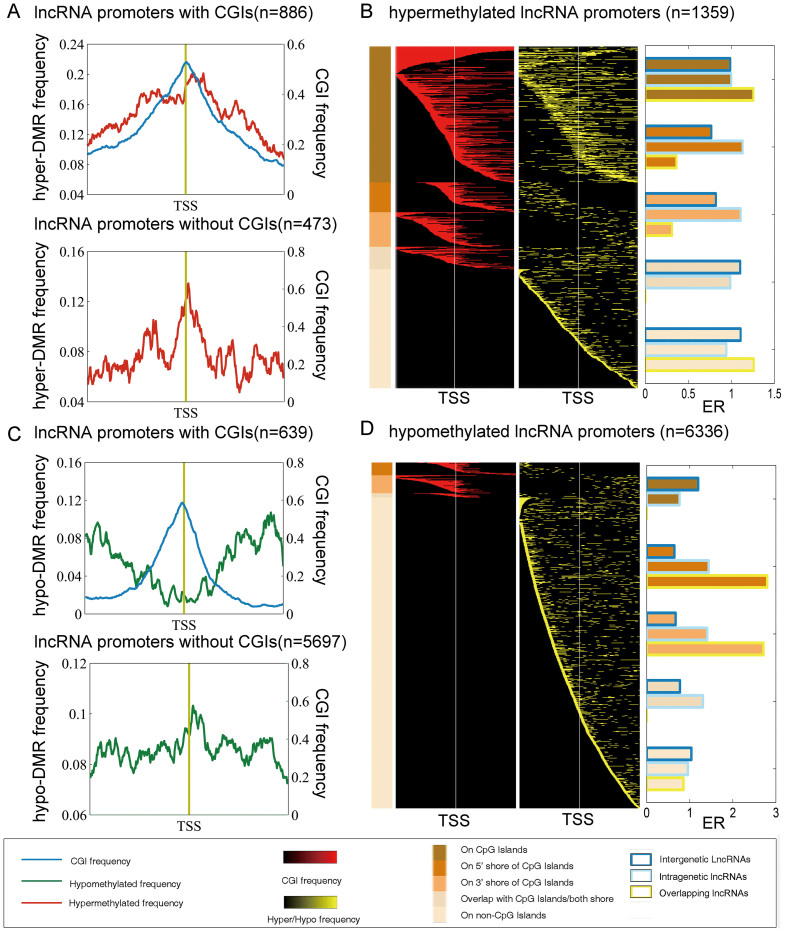
Figure 2. Aberrant methylation patterns surrounding the TSSs of the lncRNAs in breast cancer.
(A) Average aberrant hypermethylation frequency of 886 lncRNA promoters containing CGIs and 473 lncRNA promoters lacking a CGI. (B) Heat map of the CGI frequency and the aberrant hypermethylation frequency in breast cancer. A total of 1359 lncRNA promoters contained a hypermethylated region (yellow) were identified. Each row represents a unique promoter region at a 10-bp window size, covering the +/−2-kb region flanking the transcription start sites. The location of a CGI (red) in the aberrantly methylated lncRNA promoters is shown in the first column. The promoters are ordered according to the location of methylation on a CGI, or adjacent to the CGI (CGI shore); the promoters that lacked a CGI are represented with different shades of brown on the left. ER, enrichment ratio. (C) Average aberrant hypomethylation frequency of 639 lncRNA promoters containing CGIs and 5697 lncRNAs lacking a CGI. (D) Heat map of the CGI frequency and the aberrant hypomethylation frequency in breast cancer. The ratio the of lncRNA subtypes for each pattern is shown adjacent to the heat map.

