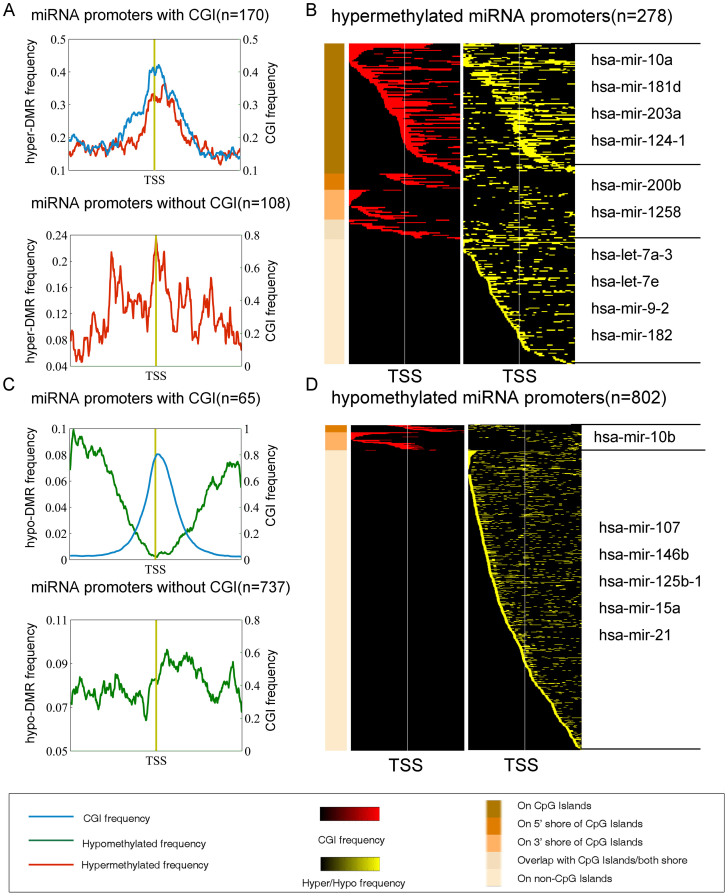
Figure 3. Aberrant methylation patterns surrounding the TSSs of miRNAs in the breast cancer samples.
(A) Average aberrant hypermethylation frequency of 170 promoters containing CGIs and that of 108 promoters that lacked a CGI. (B) Heat map of the CGI frequency and the aberrant hypermethylation frequency in breast cancer. Representative miRNAs in each group are shown on the right. (C) Average aberrant hypomethylation frequency of 65 promoters containing CGIs and that of 737 promoters that lacked a CGI. (D) Heat map of the CGI frequency and the aberrant hypomethylation frequency in breast cancer. Representative miRNAs in each group are shown on the right.

