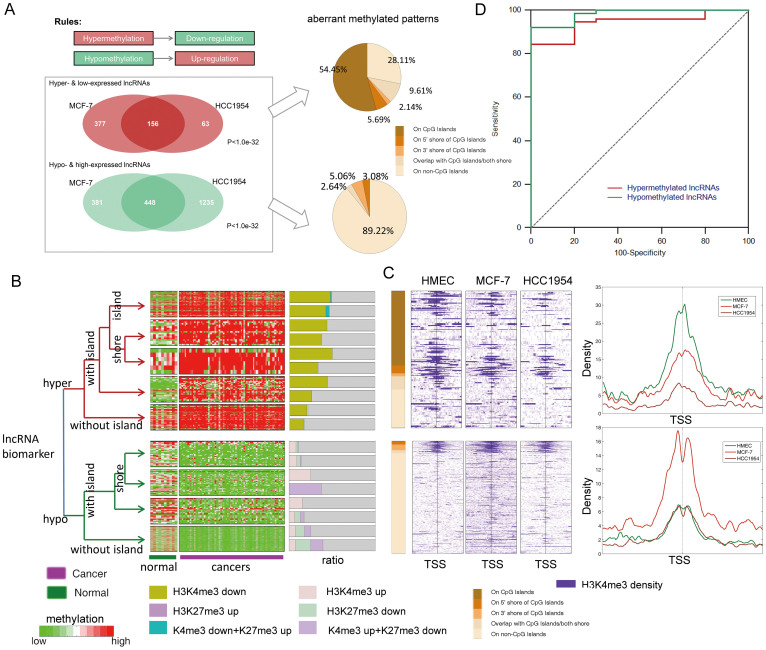
Figure 4. Regulation of lncRNA expression by DNA methylation in breast cancer.
(A) The aberrantly methylated and expressed lncRNAs in the two cell lines significantly overlapped. (B) Clustering map of selected lncRNA biomarkers for CMS methylation. The lncRNAs were grouped based on their aberrant methylation patterns. The bar graph adjacent to the heat map shows the percentage of lncRNAs in that group covered by an aberrant histone modification. (C) Colored profiles of the H3K4me3 sequencing read densities from the HMEC, MCF-7 and HCC1954 cell lines. Each profile shows the 4-kb regions surrounding the aberrantly methylated lncRNAs. The average profiles are shown on the right of the colored profiles. (D) ROC map of the selected markers.

