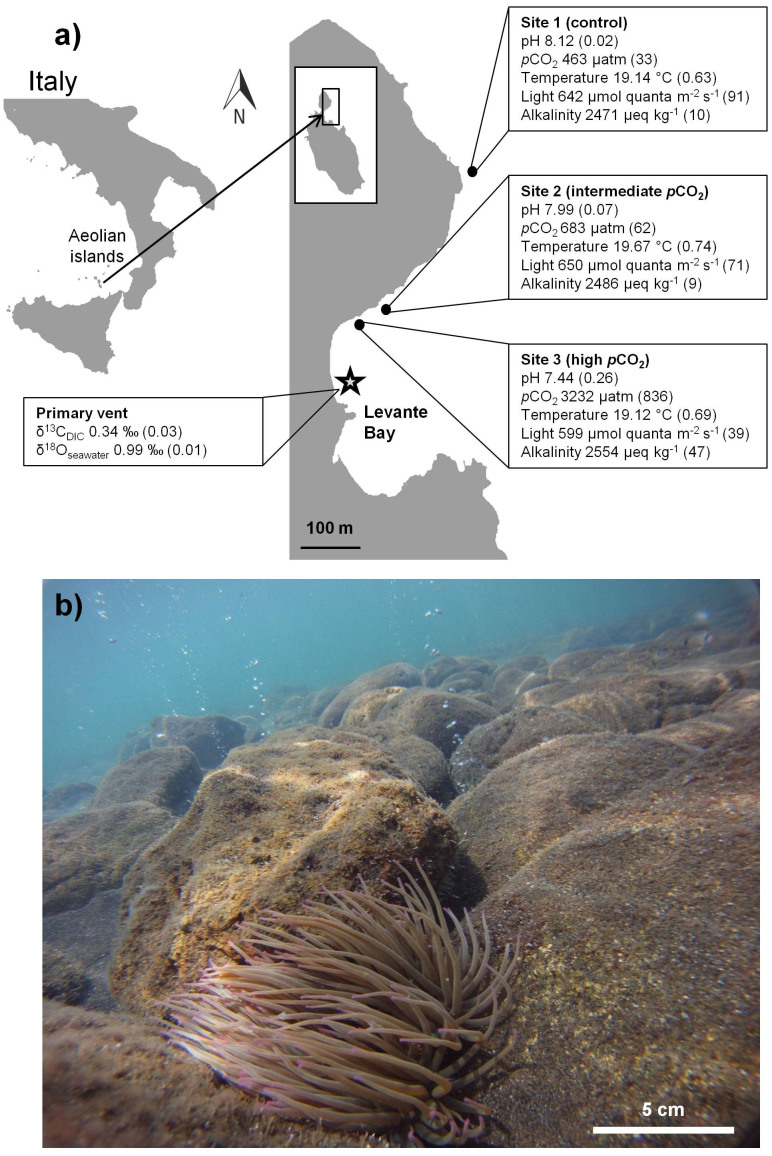
Figure 1. General information on the study sites and the studied organism.
(a) Map of the study area with sampling sites 1 (control), 2 (intermediate pCO2) and 3 (high pCO2). Boxes show mean values (±SD) of each site for: pH, pCO2, temperature, light and alkalinity. δ13CDIC and δ18Oseawater (‰) are presented for the primary vent site. The map was created in Adobe Illustrator CS3 (Adobe Systems Inc., San Jose, USA). (b) Image showing A. viridis at sampling site 3 (high pCO2). Photo credit: M. F. (b).

