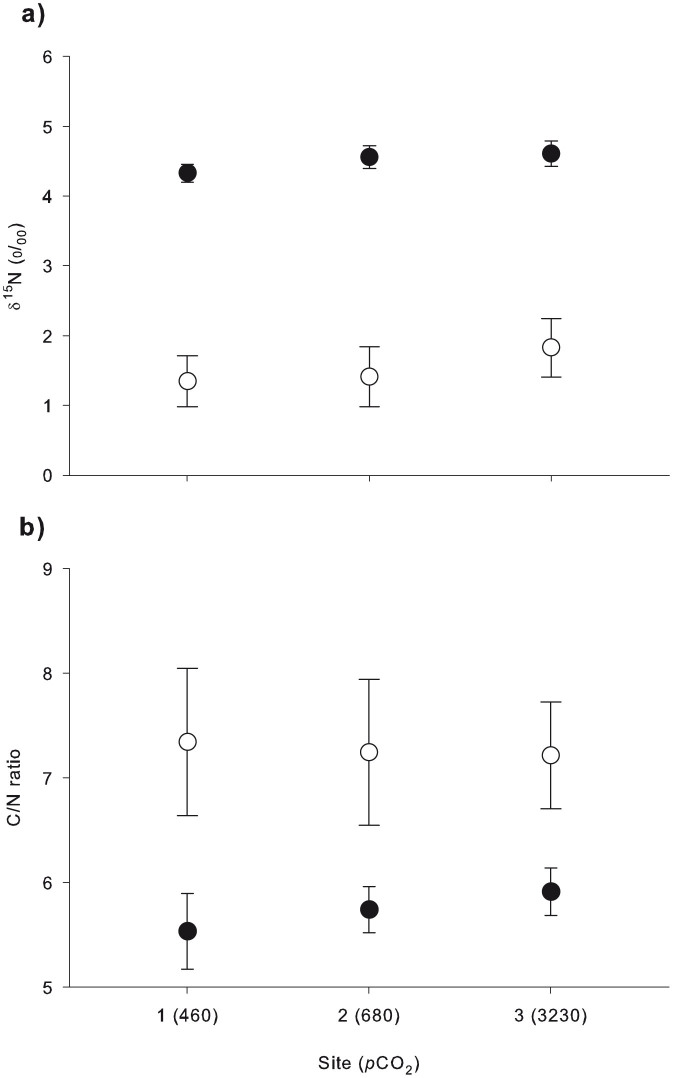
Figure 5. δ15N and C/N ratios in A. viridis from sites 1 (control), 2 (intermediate pCO2) and 3 (high pCO2).
Measurements in Symbiodinium (white circles) and animal tissue (black circles) of: (a) δ15N (‰), and (b) C/N ratio. Note that the mean pCO2 (μatm; Table 1) is given in parentheses for each site. All values represent the mean ± SEM (n = 5).

