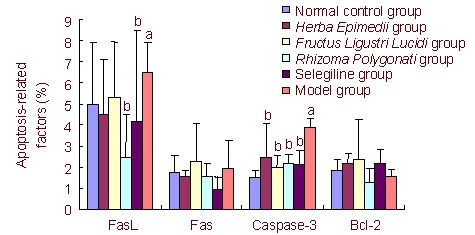
Figure 1.

Level of apoptosis-related factors in the substantia nigra and striatum after drug administration (flow cytometry, %).
Data are presented as mean ± SD. aP < 0.05, vs. normal control group; bP < 0.05, vs. model group.
One-way analysis of variance was used for data comparison between groups. Least significant difference or Games-Howell post-hoc tests were used for multiple comparisons among groups.
The percentage of expression of FasL-, Fas-, caspase-3-, and Bcl-2-positive cells was calculated through use of CellQuest software.
