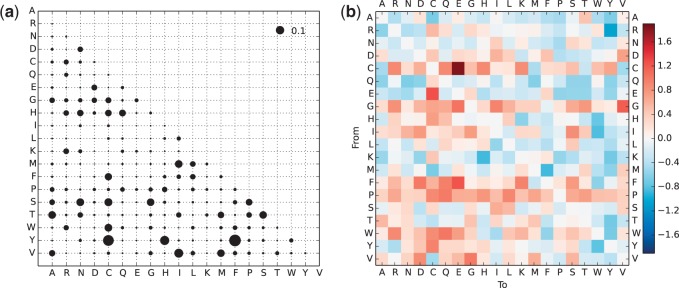
Fig. 3.—

Amino acid exchangeability rates. (a) Symmetric matrix of amino acid exchangeability rates for coiled-coil regions in the CC model. The area of each bubble represents the value of exchangeability rij between amino acid i and j. (b) Heat map representation of the difference between amino acid substitution rates in CC and LG models. The value for each square is calculated as . For both plots, values are scaled so that the expected number of substitutions per site is 1.
