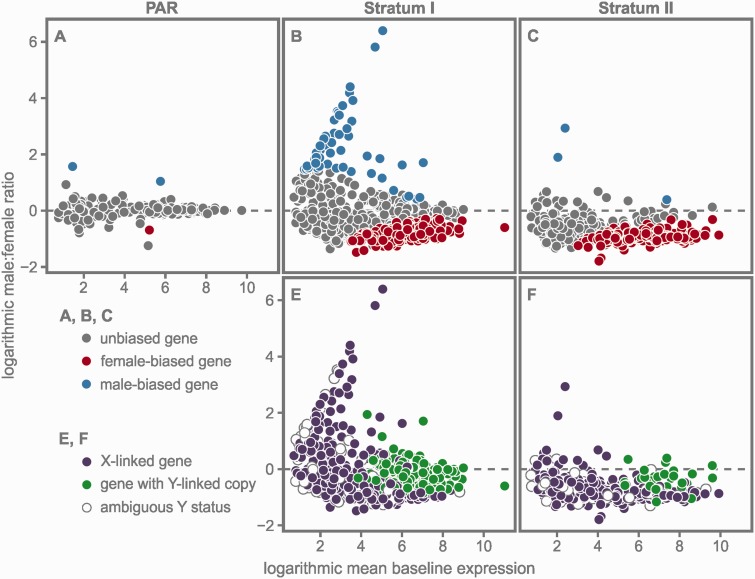
Fig. 2.—
Results of the sex-specific differential expression analyses (XY:XX) for each of the three regions in the sex chromosome: The PAR, stratum I, and stratum II. (A–C) Genes with male-biased expression levels are shown in blue, with female-biased expression levels in red. (E, F) Genes carrying Y-specific SNPs (i.e., genes with a transcribed Y-linked copy) are shown in green for each stratum. Genes without a transcribed Y-linked copy, that is, X-linked genes, are depicted in purple. Empty circles indicate genes of ambiguous Y status (see Results).

