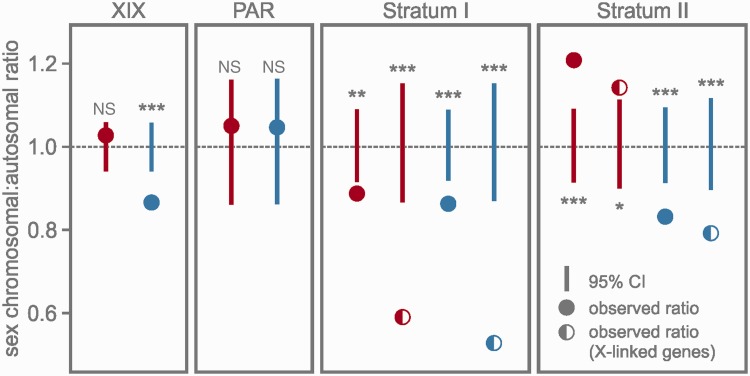
Fig. 3.—
Ratios of median expression levels of sex-chromosomal and autosomal genes (XYmale:AA, XXfemale:AA). The ratios are provided for the entire sex chromosome (XIX) and the three chromosomal regions, and are depicted as color-coded circles (red: females, blue: males). For the two evolutionary strata we also provide the ratios of median expression levels of exclusively X-linked genes for both sexes, depicted as color-coded semicircles. Vertical lines indicate 95% confidence intervals (CIs) obtained by bootstrapping the data sets and calculating the ratio of medians for each of the 10,000 bootstrap samples. Statistical significances of the observed ratios are coded as follows: NS (not significant); *P < 0.05; **P < 0.01; ***P < 0.001.

