
Fig. 4. Neural encoding of plosive and fricative phonemes.
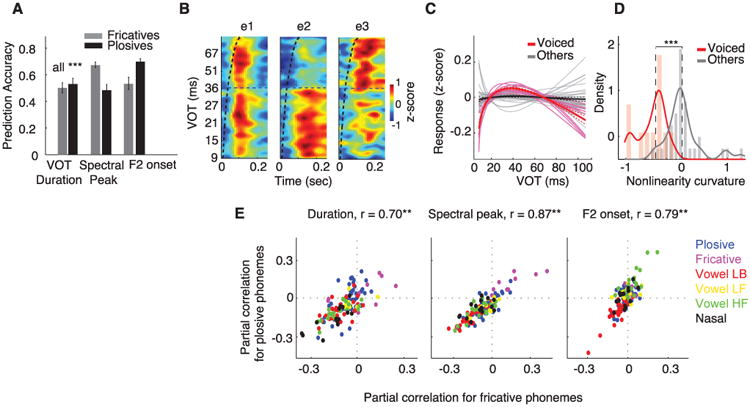
(A) Prediction accuracy of plosive and fricative acoustic parameters from neural population responses. Error bars indicate SEM. (B) Response of three example electrodes to all plosive phonemes sorted by VOT. (C) Nonlinearity of VOT-response transformation and (D) distributions of nonlinearity for all plosive-selective electrodes identified in Fig. 2D. Voiced plosive-selective electrodes are shown in pink, and the rest in gray. (E) Partial correlation values between response of electrodes and acoustic parameters shared between plosives and fricatives (**P < 0.01, t test). Dots (electrodes) are color-coded by their cluster grouping from Fig. 2C.