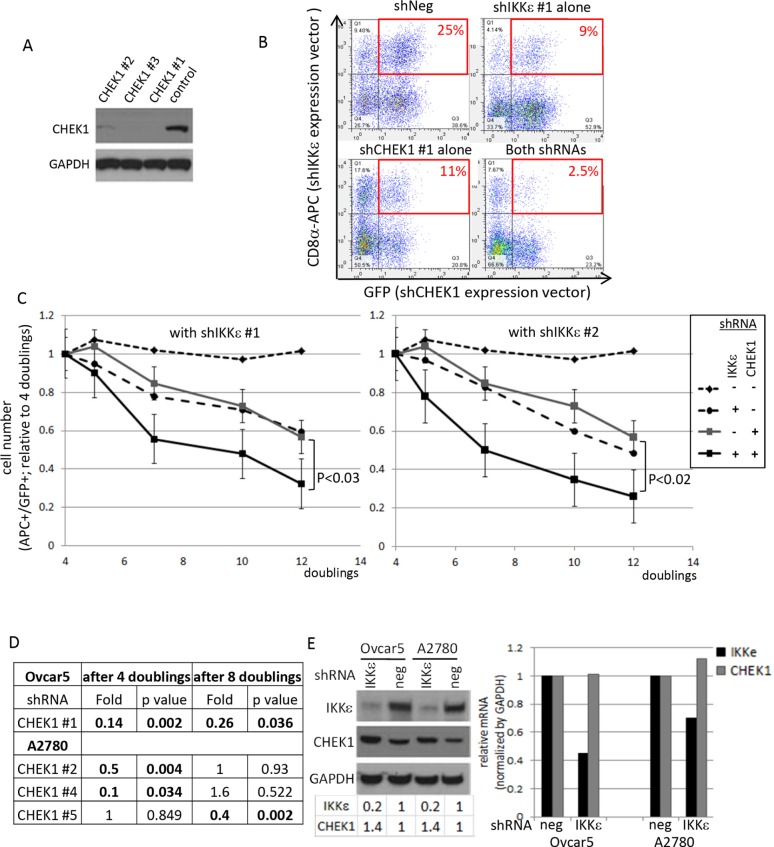
Figure 3. Validation of CHEK1 lethal effects in IKKε-mtached Ovcar5 cells.
(A) The knockdown levels of CHEK1 by 3 different shRNAs were examined by Western blot analysis. GAPDH was used as a loading control. (B) Double-positive cells after IKKε and CHEK1 shRNA knockdown were monitored by flow cytometry after two rounds of infection. Dot plots at 7 doubling times were shown. IKKε shRNA constructs co-express LYT2 (mouse CD8α) which was detected by an antibody conjugated to APC; CHEK1 shRNA constructs co-expressed GFP. (C) Two previously validated IKKε shRNAs were used. Either IKKε #1 or IKKε #2 shRNA (in pRSM-LYT2 vector) was co-infected with one of 3 different CHEK1 shRNAs (in pRSMX-PG vector) into Ovcar5 cells. The changes in double-positive cells were measured and calculated relative to 4 doublings after infection, at which GFP signal is maximal. The average number from 3 different CHEK1 shRNA in either negative shRNA or IKKε shRNA were calculated during indicated time courses. The significant p value was calculated by a 2-sided student's t-test. (D) A2780 IKKε-matched cell lines were established and shRNA library screening performed in the same manner as in Ovcar5. Using a cut-off with a fold change of ≤ 0.7 with a p-value of ≤ 0.05 shown in bold, 3 different CHEK1 shRNAs were identified at the different time points. (E) The expression levels of IKKε and CHEK1 proteins (left) and mRNAs (right) were examined upon IKKε knockdown in two cell lines. GAPDH was used as a loading control for immune blotting. The area of each band was quantified by ImageJ and normalized by GAPDH, and expressed as the level relative to its negative control. The mRNA levels were quantified by real-time PCR, normalized by that of GAPDH, and the expression was calculated relative to that in negative shRNA infected cells.

