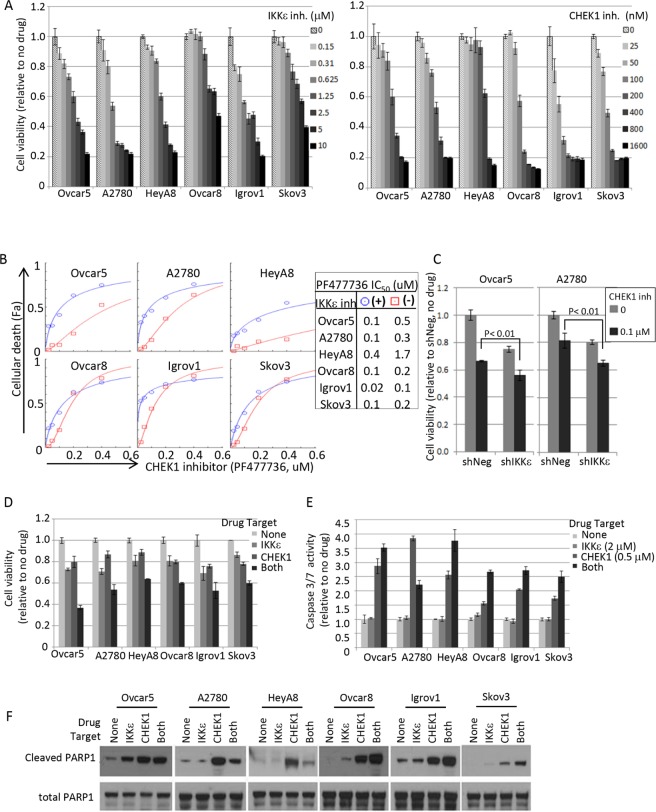
Figure 4. Pharmacological intervention of IKKε and CHEK1 in ovarian cancer cell lines.
(A) IKKε inhibitor (BX795) and CHEK1 inhibitor (PF477736) sensitivities were measured by XTT assay. Cells were seeded at 1000 cells/well in 50 μl and 4 replicates 16-20 hours prior to the addition of the drug. XTT assay was performed 3 days later upon drug treatment. The viability was calculated relative to no drug treated samples. (B) Cellular viability assay was performed in 2-fold serial dilutions of PF477736 (range 0 – 0.4 μM) in triplicate in a 96 well matrix format, and then cellular death (Fa; fraction affected) was calculated from XTT based viability fractions. IC50 was calculated using CompuSyn software. Shown are the results in the presence of BX795 (circle; 1.25 μM, except 0.625 μM for A2780) and the absence of the IKKε inhibitor (square). (C) IKKε and CHEK1 doubly depleted Ovcar5 and A2780 cells maintained in selective media (25 μg/ml of mycophenolic acid and 2 μg/ml of puromycin) were seeded in 96-well plates 24 hours prior to the addition of CHEK1 inhibitor PF477736. XTT assay was performed 3 days later upon drug treatment. Statistical tests were 2-sided between shNeg and shIKKε in the presence of CHEK1 inhibitor. (D) The relative cell viability was calculated based on no drug treatment, and is shown at the following suboptimal concentrations of BX795/PF477736: 1.25 μM/0.2 μM (Ovcar5, HeyA8), 1.25 μM/0.1 μM (Ovcar8, Skov3), 0.625 μM/0.1 μM (A2780), and 0.625 μM/0.05 μM (Igrov1). SD was calculated from 3 replicates. XTT assay was performed 3 days after treatment. (E) Caspase-3/7 activity was measured by Caspase-Glo assay after exposure to BX795 (2 μM) and/or PF477736 (0.5 μM) for 24 hours. Mean values ± SD of 3 replicates are shown and the data represent 4 independent experiments. (F) The cleavage of apoptotic indicator PARP-1 was examined by Western blot analysis. Cells were treated for 24 hours as the same conditions as in Figure 4E and harvested for total cell lysate preparation. Total PARP1 is shown as a loading control.

