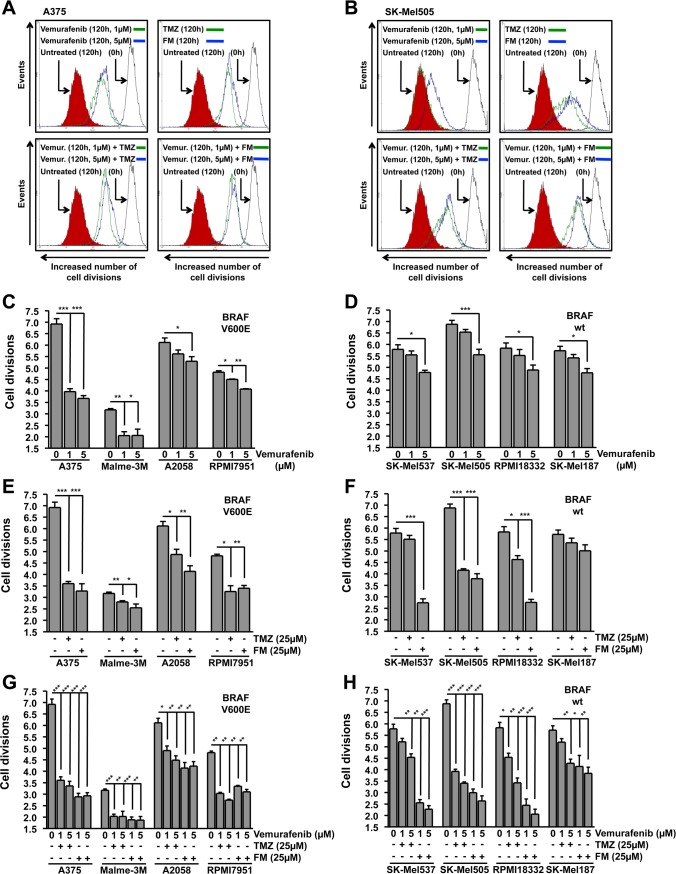
Figure 3. Inhibition of cell division.
Cells were treated with the chemotherapeutic and the number of cell divisions following 120h incubation was determined using flow cytometry of CFSE stained cells. Presented data are from at least three independent experiments. *p<0.05, **p<0.005, ***p<0.0001. MGMT was depleted with O6BG (10 μM) 1h before TMZ or FM. Representative flow cytometry histograms for BRAF mutant (A375) (A) and wild-type (SK-Mel505) (B) cells. The solid black line on the right represent CFSE stained cells at 0h, filled red histogram on the left represent untreated CFSE stained cells following 120h incubation while green and blue lines represent CFSE stained cells treated with indicated chemotherapeutics following 120h incubation. Quantification of the inhibition of cell division in BRAF mutant (C) and wild-type (D) cells following vemurafenib addition. Quantification of the inhibition of cell division in BRAF mutant (E) and wild-type (F) cells following either TMZ or FM addition. Quantification of the inhibition of cell division in BRAF mutant (G) and wild-type (H) cells following vemurafenib addition in combination with either TMZ or FM. Vemurafenib was added to the cells 1h after TMZ or FM.

