
Figure 4. Comparison of the differential ECM activation in three subtypes of salivary gland tumors and their matched normal samples.
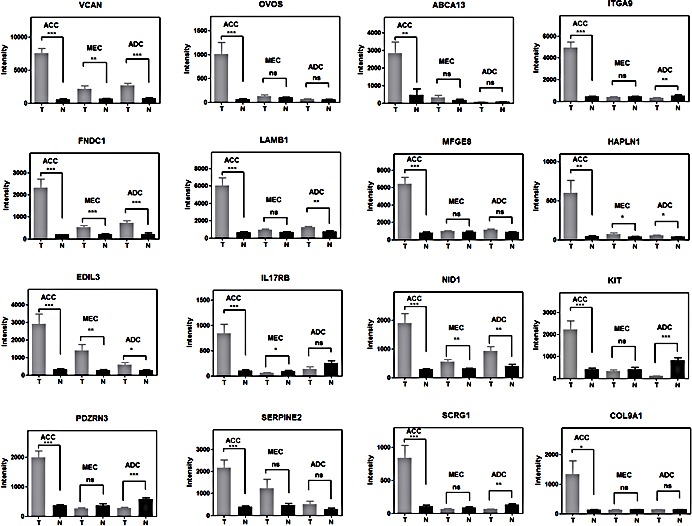
***, t-test, two side p-value<0.0001; **, p-value<0.001; *, p-value<0.05; ns, p-value >=0.05. Error bars are S.E.M. of 12 replicates of ACC, 14 replicates of MEC and 11 replicates of ADC.