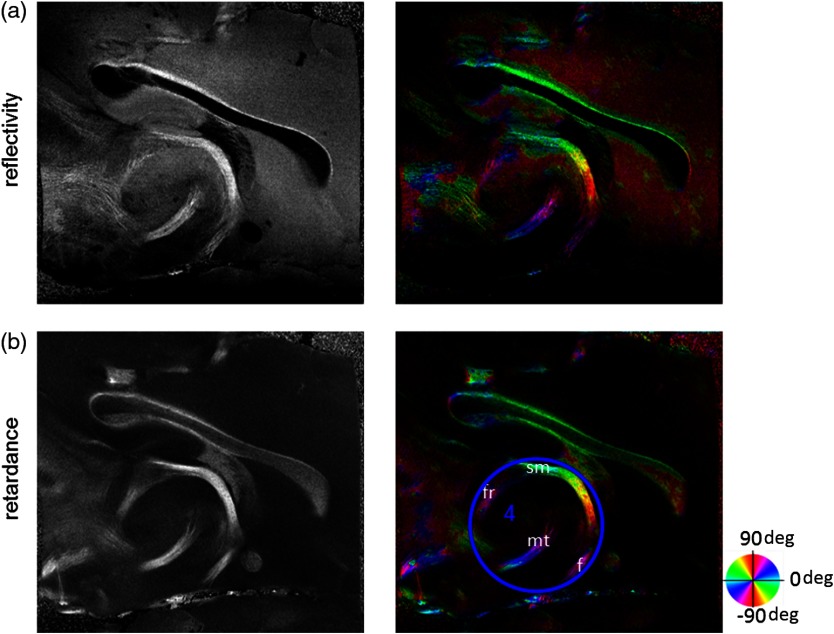
Fig. 2.
The 2-D ST analysis on (a) en-face reflectivity and (b) retardance images. Left: original images, right: orientation maps computed by eigenvector of ST. Color wheel shows the orientations. Brightness is controlled by the pixel intensities in corresponding en-face images. sm: stria medullaris thalamus, f: fornix, mt: mammillothalamic tract, and fr: fasciculus retroflexus. The round area in blue indicates the ROI 4 for Fig. 4(b).

