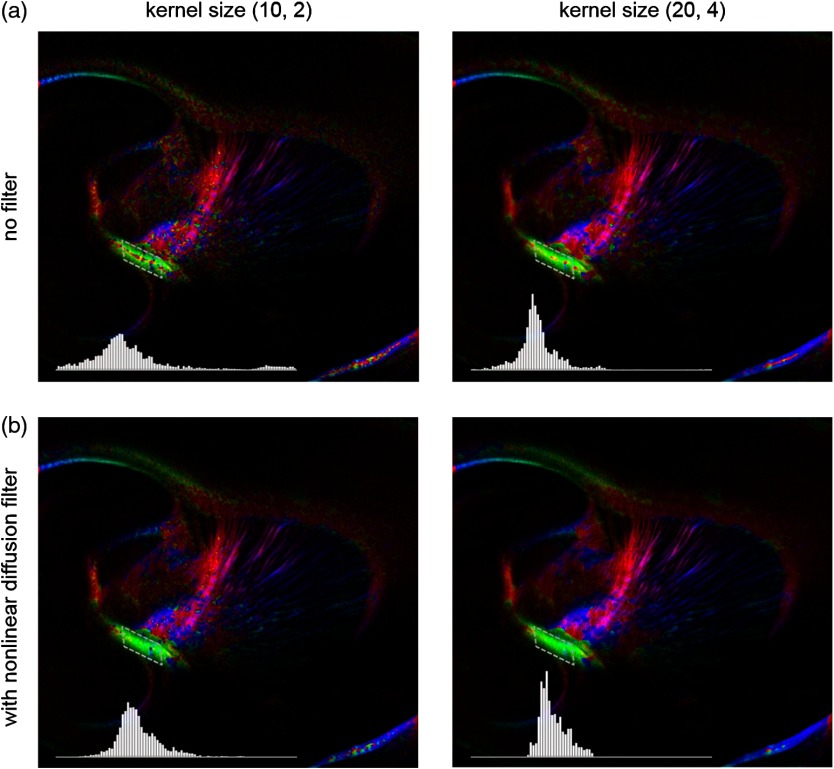
Fig. 3.
Filtering and kernel size effects on the computational orientation maps: (a) without filter; and (b) with nonlinear diffusion filter applied on SOCS images. The sizes of the smoothing kernels are (left) and (right), respectively, where the first subscript is the number of neighboring pixels included in smoothing and the second subscript is the standard deviation of the Gaussian kernel. The color-coding is in Fig. 2. The white boxes indicate the region of interest (ROI), whose fiber orientation distributions are plotted with histogram (white bars) on individual images (range: , binning: 2 deg).

