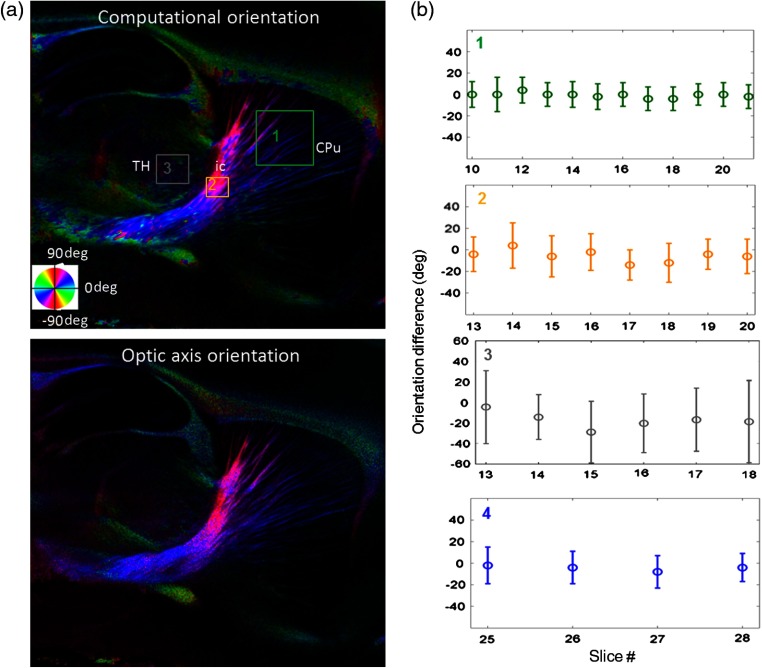
Fig. 4.
Comparison of computed and measured orientations: (a) The orientation maps of a sagittal section share the same color-coding (color wheel), and the brightness is controlled by the en-face retardance values. CPu: caudate putamen, TH: thalamus, cc: corpus callosum, and ic: internal capsule. (b) Mean (circles) and standard deviation (bars) of the difference between computed and measured fiber orientations are plotted for all ROIs and respective slices. Pixels having low retardance () are excluded in the statistical analysis. ROIs of the first three plots are indicated on (a). ROI of the last plot contains multiple fiber bundles as shown in Fig. 2 including f, fr, mt, and sm. The ROIs are across multiple slices [-axis in (b)].

