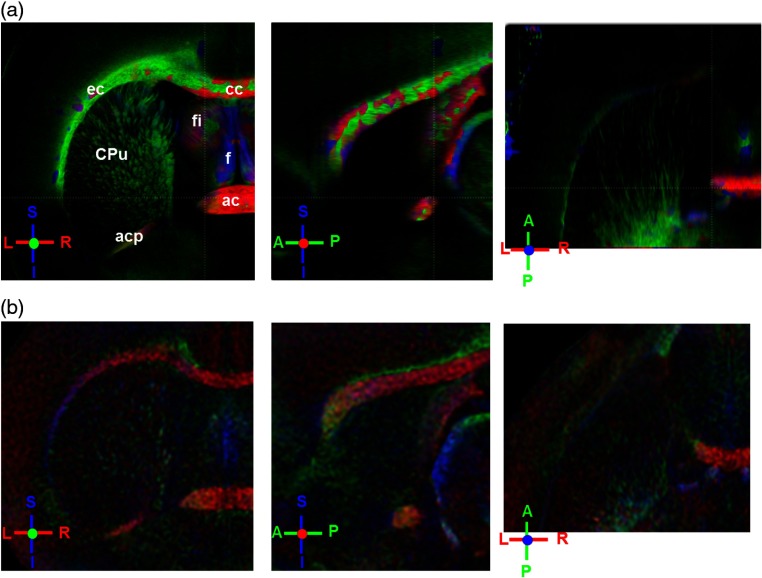
Fig. 5.
(a) The 3-D ST for fiber orientations at mesoscopic resolution. The ST is calculated from a stack of en-face retardance images and the orthogonal images are visualized in Vaa3D34 (left: coronal, middle: saggital, and right: horizontal). The color represents the fiber orientations (red: left-right, green: anterior-posterior, and blue: superiorinferior). Directions are labeled on the individual viewing plane. The image intensity is masked by the retardance value which highlights the white matter. CPu: caudate putamen, acp: posterior branch of the anterior commissure, cc: corpus callosum, ec: external capsule, f: fornix, and fi: fimbria of the hippocampus. Sample size: . (b) Microscopic diffusion tensor atlas of a Wistar rat brain (resolution: 50 μm) shows the correspondence with the same color-coding. The fiber orientation maps are shown superimposed on the fractional anisotropy images, which were obtained from the public online dataset at the Duke Center for In Vivo Microscopy.

