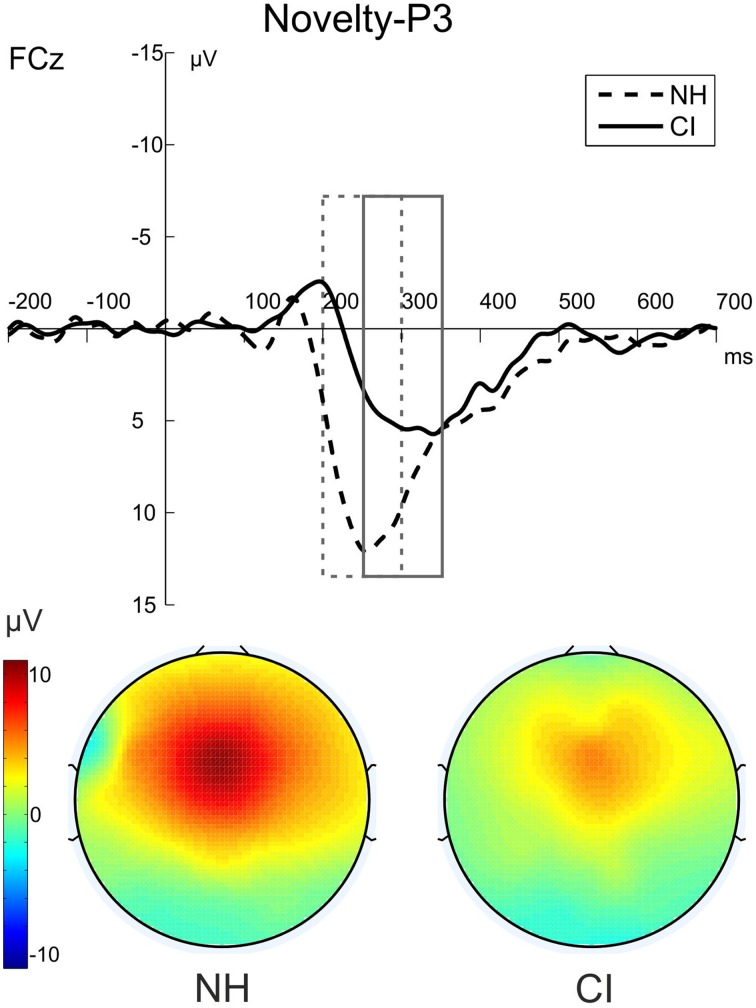
Figure 6.
The novelty-P3 (novel-standard difference waveforms) for NH participants (dashed) and CI users (solid) in the auditory-visual DFD. The figure shows the ERPs at FCz and the voltage maps illustrating the mean over the analyzed time window for NH participants (200–300 ms) on the left and for CI users (250–350 ms) on the right.

