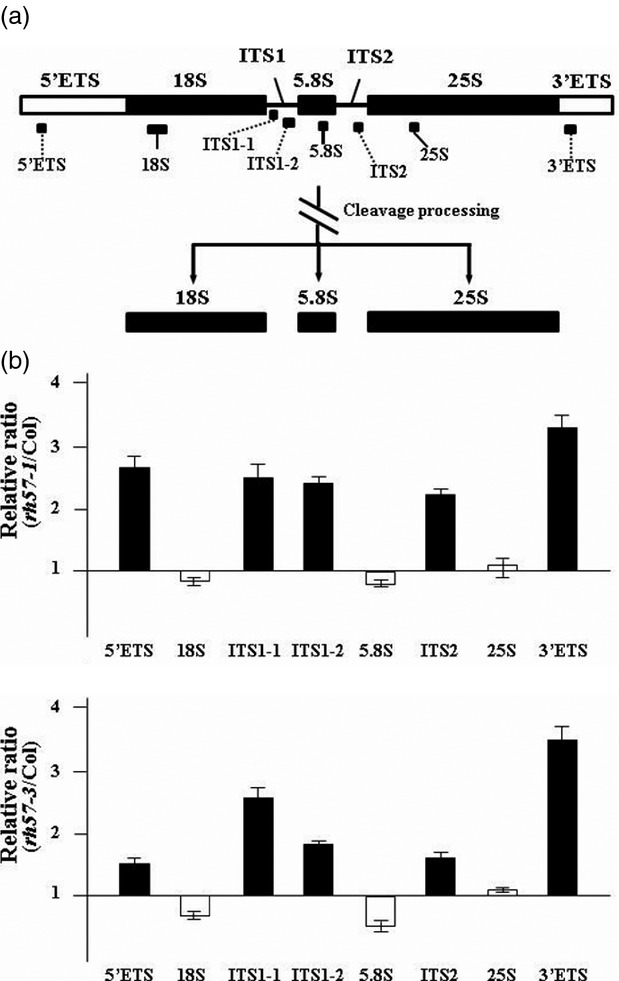
Figure 9.

Reduced pre-rRNA processing in rh57 mutants. Comparison of the relative levels of the various regions of pre-rRNA in 9-day-old WT Col-0 and rh57 mutant plants. (a) Primer sets specific to various regions of 45S/35S pre-rRNA were used for synthesis of the first-stranded cDNA and determination of the levels of corresponding RNA sequences by qRT-PCR analysis. (b) Signal values for each PCR product were compared between rh57 and Col-0 plants. Black bars represent ETS and ITS sequences, and white bars represent 18S, 5.8S and 25S rRNAs. The values represent the means ± standard deviation (SD) for two independent isolations of RNAs.
